Download
1 / 38
390 likes | 548 Views
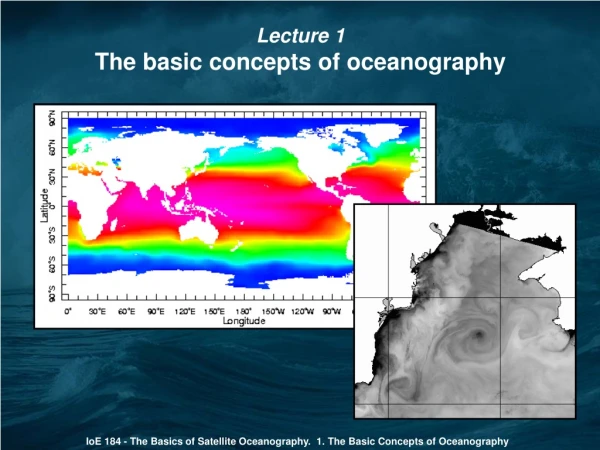
Satellite Oceanography FY05 Q1. ORAD Quarterly Review Contents. 1 st Quarter Highlights ORAD Quad Chart Supporting Information Performance Parameters Schedule and Major Milestones Budget & Resources Issues, Risks, and Corrective Actions Summary & Look Ahead Backup PPBES ORAD Quads.

E N D
ORAD Quarterly Review Contents • 1st Quarter Highlights • ORAD Quad Chart • Supporting Information • Performance Parameters • Schedule and Major Milestones • Budget & Resources • Issues, Risks, and Corrective Actions • Summary & Look Ahead • Backup PPBES ORAD Quads
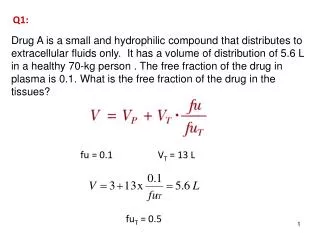
1st Quarter Highlights • First identification of tsunami signature in altimetry data.
Major Performance Measures Performance Issues NEED ALL PP, Schedule, and Issues/Risks Funding (K) Schedule
Performance Parameters • Include additional detail or discussion of Performance Measures shown in summary • Address variances and corrective actions as needed
Schedule – Major Milestones • Conduct a satellite ocean color calibration and validation experiment focused on Hyperion hyperspectral data for the Chesapeake Bay • Q1 Complete • Complete initial validation of the Depth Integrated Primary Productivity Model • Q4 In progress • Detailed Milestones • Transfer operation of OSCAR processing from NOPP contractor to SSH team. • Transfer research to operations • Complete • OKEANOS processing operational with Level-1 ocean color data for West Coast and Gulf of Mexico geographic areas. • Transfer research to operations • Complete
Obligation PlanOR & F - FY 2005 Plan vs. Actual Obligations($ in Millions)
Obligation PlanPAC - FY 2005 Plan vs. Actual Obligations($ in Millions)
Budget Detail & Variance ($K) Work Breakdown FY 05 FY 05 % Structure Plan ActualVariance Ocean Remote Sensing 26.5% 266 26.5 Coral Reef Watch 0 0 0 Explanation of Variances
Personnel ResourcesFY 2005 Plan vs. Actual FTE
Explanation of Variances • Four FTE losses: • 1 in 2002 • 2 in 2003 • 1 in FY04 Q3. • 1 in FY05 Q1 – retired; • 3 Replacement hiring in process during FY05Q1. (Hiring completed for 2 FTE in Jan 05) • Budget reduction precluded earlier replacements. Insufficient funding to replace remaining 2 FTE.
Federal Employees, Contractors and Grantees Plan vs. Actual FTE
Issues, Risks, and Corrective Actions • Personnel shortages will adversely impact ORA’s scientific leadership role in the GOES-R acquisition process, as well as the NPOESS acquisition. • Mitigation • Replacement hires are proceeding as planned, with the exception of those that are funding limited. • Focus is being placed on skills needed to facilitate technical support of the new operational systems • Marine Optical Buoy (MOBY) • Transition of research/development to operations • Critical calibration asset for NPP/NPOESS VIIRS and GOES-R HES-CW • Falling through cracks: • NO SINGLE RESPONSIBLE NOAA PROGRAM • NO OWNERSHIP OF RESPONSIBILITY FOR FUNDING • PARTIAL NASA FUNDING ONLY INTO FY06 • Mitigation • Need SHARED funding commitment by relevant programs (acquisition and operational) for ocean color calibration • Need clear designation of entities responsible for acquisition support funding and clear designation of entities responsible for operational funding
Summary & Look Ahead Major Milestones • No FY05 Q2 major milestones Detailed FY05 Q2 Milestones • TETHYS development system operational/capable with ocean color calibration/validation transitioned from ESDIM and O2K. • Improve product timeliness, accuracy, & availability • Produce and distribute GFO altimeter data from the second half of calendar 2004 • Develop new products • Complete MOBY time-series reprocessing • Improve product accuracy
Management Issues & Upcoming Activities Management Issues • Satellite Oceanography Division replacement personnel needed • Funding limitation • Billet limitation • MOBY funding crisis • At risk to lose globally-unique ocean color calibration facility and tie point between different satellite systems • At risk to lose planned NPP/NPOESS and GOES-R cal/val component • Crucial component for ocean color climatology data • No inter-program coordination/commitment with/between acquisition or operational programs • As currently funded, MOBY expires in mid-FY06 • Need to designate NESDIS matrix management representative for the new Mission Goal 3 Coasts, Estuaries, and Oceans Program (CEO) Upcoming Activities • MOBY close-out and equipment disposal (FY06, if no further funding identified)
Other Milestones: Altimetry NESDIS/ORA SCIENTISTS FIRST WITH SEA LEVEL OBSERVATIONS OF INDIAN OCEAN TSUNAMI FROM SATELLITE ALTIMETRY Sea level observations from 4 different altimeter missions show multiple wave crests and troughs radiating across the Indian Ocean with amplitudes as large as 60 cm. Altimeter data can be used to improve tsunami hazard forecasting by (1) helping calibrate and validate tsunami wave models and (2) providing better ocean bathymetry maps from which wave energy patterns can be estimated. Walter Smith, Remko Scharroo (Lab for Satellite Altimetry) & Vasily Titov (PMEL)
Other Milestones: Altimetry PACIFIC SURFACE OCEAN CURRENT ANALYSIS • NOPP Project (OSCAR I) Ocean Surface Current Analysis • Employs Altimeter and scatterometer measurements • Became Operational at LSA in December 2004 • Estimates 10-day average currents at 5 day interval • Provides currents in the equatorial Pacific • Detects current changes due to El Nino and La Nina
Other Milestones: Ocean Color • Conducted a MOCE calibration and validation experiment focused on Hyperion • Chlorophyll-a trackline collected on October 3, 2004 • during the Turbid 9 ocean color algorithm • development and satellite calibration/validation • experiment. This experiment in the Chesapeake Bay • supported the Hyperion, SeaWiFS, and MODIS • Terra and Aqua ocean color sensors. Continuing Milestones Completed… • Continue to maintain MOBY observation platform for ocean water-leaving radiances for MODIS/Aqua and MODIS/Terra calibration and validation with buoy swapout (Cruise L112). • Conduct MOBY data workshop with participants from NOAA and Moss Landing Marine Labs. • Initiated the reprocessing of the MOBY seven year time-series.
Other Milestones: CoastWatch • Incorporation of a chlorophyll-a concentration product and a wind stress curl product into the El Niño Watch Report. • Development of near-real time ocean surface wind products integrating satellite scatterometer and NOAA National Weather Service buoy data. • Development of a near-real time sea level product integrating satellite altimeter and tide gauge data. Target date is June 30, 2005.
Other Milestones: CoastWatch • Central Node • Added new region "Western Hemisphere" to accommodate GOES 10 & 12 SST product merges. • Added GOES-9 SST Pacific Basin region to search interface. • Okeanos ocean color processing system online. Near real-time imagery of the "Gulf of Mexico" and "West Coast" regions available from MODIS/Aqua and Terra, whereas all CW regions available from OrbView-2/SeaWiFS. (Qtr 1 Milestone) WesternHemisphere Caribbean/Gulf of Mexico • The Caribbean and Gulf of Mexico (GoM) nodes merged bringing individual node capabilities together. • Detected significant anomalies in the along-track blended sea height data stream coming from the Navy, thus enhancing the way operational altimeter data is quality controlled. • Use empirical relationships between sea surface carbon dioxide fugacity (fCO2), SST and location to create fCO2 fields in the Caribbean Sea to create weekly flux maps for the region from 15N to 30N and 60W to 90W to identify sources of CO2 sinks. GOES 9: Pacific Basin
Other Milestones: CoastWatch Alaska Node • Supporting soy bean and oil spill of the Selendang Ayu off Unalaska Island with satellite data of the area. • Presented workshop on how to interpret POES infared imagery to Eskimo Walrus Commissiom. Great Lakes Node • New products such as 250m resolution imagery in near-real-time and winter ice cover and improving AVHRR turbidity products. • CoastWatch demonstration at GLERL open house to participants of the Open Lake Sensor Technology Conference. • During the period October 1, 2004 – December 28, 2004, visitors to the CoastWatch Great Lakes Node web site have come from 57 different domains (such as .gov, .edu, .com, .mil etc.). During this period, the web site was visited 45126 times, with 2.1% from .gov, 2.0% from .edu, 20.0% from .com, 0.9% from .mil, 0.5% from .us, 33.4% from .net, 0.8% from .org (see attached Figs for detail). Lake Erie
Other Milestones: CoastWatch Central Pacific Node • Expanding from 120° E – 80° W; 60° N – 30° S to 100° E – 60° W; 70° N - 70° S enabling the NOAA CoastWatch – Central Pacific Node to provide updated remote sensing information for the entire Pacific basin.
Other Milestones: Sea Surface Roughness • A proposal is being developed for an agreement with the University of Miami for funding to access near-real-time data from CSTARS • Dynamic Allocation Ship Detection Algorithm Upgrade was developed and documented. • Contract was awarded for complete development and testing of wave state information from ENVISAT ASAR. • Ice mask algorithm was modified and is being tested. • SAR User’s Manual and AKDEMO Course material added to AKDEMO Web Site. • SAR Wind User’s Guide internal review completed. • Calculating routine SST gradient product for GhostNet-2 flight. Literature search completed and briefing paper being written. • Sent FY05 RPP for NCCOS Partnership Proposal to Nathalie Valette-Silver. • GIS formatted SST gradient product completed. Shapefiles of chlorophyll and SST have been produced for GhostNet. • Software has been developed and is being validated for handling ENVISAT data received at CSTARS to calculate wind. • SAR wind system software has been ported to CSTARS and is being tested and validated using RADARSAT-1 and ENVISAT data.
CRW launches New Satellite Bleaching Alert (SBA) Page for automated early warnings of increased thermal stress: • Experimentally being tested with several key Reef Managers • Expected to go 24/7 to Registered Users Feb 2005 ============================================================================== ** [CRW Alert] Fiji-Beqa: Bleaching Watch ============================================================================== Satellite observations: 1/8/2005 - 1/11/2005 -- Sea surface temperature : 28.9000 Deg C -- Coral bleaching HotSpot : 0.700000 Deg C -- Bleaching Degree Heating Weeks : 0.00000 Deg C-week -- Maximum Monthly Mean SST at site : 28.1000 Deg C For more information, please visit the coral bleaching indices web site: http://www.osdpd.noaa.gov/PSB/EPS/CB_indices/coral_bleaching_indices.html Previous Three Alerts for Fiji-Beqa: --04/17/2004 No Stress --03/30/2004 Bleaching Alert Level 1 --03/02/2004 Bleaching Warning SST Time Series: http://coralreefwatch.noaa.gov/satellite/images/current/SST_Fiji_Beqa.png Reef site name: Fiji-Beqa SST Pixel latitude: -18.5000 SST Pixel longitude: 178.500 Sample Alert Notification Other Milestones Coral Reef Watch • The Nature Conservancy (TNC) Palau Project completed • Modeling – Hydrodynamic model • Tidal mixing points to circulation/mixing variability that relates to variable bleaching resilience affecting thermal stress
CoastWatch/Status of TethysGu/Ramachandran/Hughes Other Milestones: Sea Surface Temperature • Running Ocean Color Validation GOES SST FrontsMavor/Legeckis/Chang • Moving forward with transition to Operational Demonstration • Developed 10-day Frontal Probability to compliment monthly Frontal Probability. • Established collaboration with M. Gleason (Nature Conservancy). WindSat SSTMavor/Chang • Presented initial WindSat SST results, along with other WindSat EDR results, at IGARSS (Sept ’04), SPIE (Nov ’04) and WindSat Cal/Val meeting (Nov ’04) and U.Maryland/NOAA Cooperative Inst. for Climate Studies (Dec ’04) • Submitted proceeding paper for SPIE • Further developed SST algorithm for SDR release 1.6.1, with EDR release of Feb ’05. • Peer-reviewed article to be submitted to TGARSS special issue (Feb)
Other Milestones: Sea Surface Temperature • Evaluation of EUMETSAT MSG Sea Surface Temperature Product • Eumetsat Ocean and Sea Ice Facility, operated by Meteo-France, offered to provide a SST product for evaluation with NOAA GOES-12 operational SST product. • PROPOSALS FUNDED • GIMPAP (GOES Algorithm Development/Validation)-$57K • PSDI POES/GOES BLENDED-(Operational Implementation)$85K • PSDI GOES ( GOES Readiness and Maintenance)-$120K • POES/GOES BLENDED SST • Software delivered to Tetys • Validation System Designed • ORA Contractor implement code end of January • Validation Software being set up • Geostationary Sea Surface TemperaturesDeliveredupdated Bayesian Cloud Mask codewithAlgorithm Theoretical Basis Document • New Matchup Database Generated • Validation Data being Collected • GOES Reprocessing • Equipment purchased for contractor • Identified contractor for reprocessing work • Interview Contractor • Plan to Hire in February
Other Milestones: Sea Surface Temperature • Summarized historical EXT data for all NOAA, EOS, ERS platforms • Fit with two harmonics equation • Can predict NOAA orbit evolution • Example for N16 shown Peer-reviewed publications: Published -Ignatov Ignatov A., I. Laszlo, E. Harrod, K. Kidwell, and G. Goodrum, 2004: Equator crossing times for NOAA, ERS and EOS sun-synchronous satellites. Int. J. Remote Sens.,25, 23, 5255-5266. http://www.orbit.nesdis.noaa.gov/smcd/emb/aerosol/ignatov/peer/IgnatovEtAl-IJRS-2004.pdf
Other Milestones: Sea Surface Temperature Peer-reviewed publications: Cont’d • Example for N17 shown • EOS/ERS: corrected in flight, cannot be predicted Critical for every environmental/ climate data record (SST/aerosol/ vegetation/cloud/ozone) from each sensor (AVHRR/HIRS/SBUV/MSU)
Other Milestones: Sea Surface Temperature Inter-comparison of satellite retrieved aerosol optical depth over ocean during the period Sep 1997 to Dec 2000. This study continues and extends the previous cross-platform/sensor/ algorithm comparisons. The NESDIS single-channel aerosol product (shown in upper left) continues to perform well compared to other aerosol products. Myhre, Strodal, Johnsrud, Diner, Geogdzhaev, Haywood, Holben, Holzer-Popp, Ignatov, et al., 2004: Inter-comparison of satellite retrieved aerosol optical depth over ocean during the period Sep 1997 to Dec 2000. Atm. Chem. Phys. http://www.copernicus.org/EGU/acp/acpd/4/8201/acpd-4-8201.pdf Peer-reviewed publications: Submitted Dec 2004
Other Milestones: Sea Surface Temperature NLSST Anomalies Dec 2003 NOAA-17 (10 AM) Signal: ~1C Noise: ~0.5C NOAA-16 (2 PM) SNR: ~2
Other Milestones: Sea Surface Temperature Conclusion to SST Diagnostics • N16/17 SSTs are highly self- and cross-consistent • Noise can be reduced. AVHRR SST/Aerosol redesign underway • Need go from global analyses to local space/time domains • Work underway to implement consistency checks in NRT • Need high quality/resolution SST climatology Self- and Cross-Consistency checks - Valuable tool to check quality/adjust global SST/Aerosol products - Instrumental in new product development (new AVHRR, GOES-R) - Will be useful in NPOESS/VIIRS era to check contractor’s products
Other Milestones: SST Validation Efforts • NOAA-16 and -17 SST Global Statistics for 2004 Cold Bias for NOAA-16 both Day and night # of Matchup 3000 – 3600 Bias < 0.1C # of Matchup 4700-5100 NOAA-17 Night Time NOAA-17 DayTime Summary: Both NOAA-16 Day and Night statistics show cloud bias greater Than 0.2C. STD is reasonable at about 0.5C. NOAA-17 has no such large bias. The bias is less than 0.1C and The Std is less than 0.5C. STD 0.46-0.51C STD<0.50C # of Matchup 3000-3700 Cold Bias starting from to 0.25 C # of Matchup 4000-5200 Cold Bias starting from to 0.22 C NOAA-16 Day Time NOAA-16 Night Time STD 0.45-0.50C STD 0.48-0.52C
Other Milestones: Publications Conferences & Meetings • Heron, S.F. and Skirving, W.J. (2004) "Determining the risk of coral bleaching in Palau", Seventh International Marine Environmental Modeling Seminar, Washington DC USA, 19-21 October 2004. • Heron, S.F. and Skirving, W.J. (2004) "Satellite bathymetry use in numerical models of ocean thermal stress", PORSEC2004, Concepcion Chile, 29 November-03 December 2004. • Heron, S.F., Liu, G., Arzayus, L.F., Skirving, W.J. and Strong, A.E. (2004) "A benefit from hurricanes”, PORSEC2004 poster, Concepcion Chile, 29 November-03 December 2004. • Coral Reef Watch (2004) "Why was Charley beneficial?", US Coral Reef Task Force meeting poster, Miami USA, 29 November-03 December 2004. Technical Report Steinberg, C.R., Heron, S.F., Skirving, W.J., McLean, C. and Choukroun, S.M.,(2004) "Palau Oceanographic Array Data Report, August 2003 - January 2004.” Report to The Nature Conservancy. Australian Institute of Marine Science and National Oceanic and Atmospheric Administration. 246pp. Book Chapters Skirving, W.J., A.E. Strong, G. Liu, C. Liu, F. Arzayus, J. Sapper and E. Bayler, Extreme events and perturbations of coastal ecosystems: Sea surface temperature change and coral bleaching. Chapter 2 in Remote Sensing of Aquatic Coastal Ecosystem Processes, L.L. Richardson and E.F. LeDrew (Co-Eds), Kluwer publishers – in press Other Publications • Skirving, W.J., Coral bleaching – was 1998 a portent of the future or a 1/1000 year event: satellite derived data. In: 2004 ICRI State of the Reefs Report, Published by the Australian Institute of Marine Science, 2004. • C.R. Steinberg, S.F. Heron, W.J. Skirving, C. Mclean and S.M. Choukroun (2004) Palau Oceanographic Array Data Report, August 2003 – January 2004. Report to The Nature Conservancy. Australian Institute of Marine Science and National Oceanic and Atmospheric Administration. 246pp. 2004
Other Milestones: Publications Journals • Berkelmans, R., G. De’ath, S. Kinimonth and W. Skirving, Coral bleaching on the Great Barrier Reef: Correlation with sea surface temperature, a handle on ‘patchiness’ and comparison of the 1998 and 2002 events. Coral Reefs, 23, 74-83, 2004. • Heron, M. and W. Skirving, Swell waves as a mitigating factor in coral bleaching. Coral Reefs, (in review). • Heron, M., W.J. Skirving, K.J. Michael, Predicting ocean wave slope distributions for remote sensing applications. IEEE Trans Geo and Rem Sens, (in press). • Heron, S., E.J. Metzger and W.J. Skirving, Observations of the ocean surface circulation in the vicinity of Palau. Journal of Oceanography, (in review). • Heron, S.F. and Skirving, W.J. (2004) "Satellite bathymetry use in numerical models of ocean thermal stress", La Revista Gayana, 68(2), pp.284-288. • Heron, S.F., Metzger, E.J. and Skirving, W.J. (submitted to Journal of Physical Oceanography, Dec2004) "Observations of the ocean surface circulation in the vicinity of Palau". • Ignatov, A., J. Sapper, I. Laszlo, N. Nalli, A. Harris, W. Pichel, A.E. Strong, E. Bayler, X. Li, and E. Maturi, Global Operational Sea Surface Temperature And Aerosol Products From AVHRR: Current Status, Diagnostics, And Potential Enhancements. In proceedings 13th AMS Conf. on Satellite Oceanography and Meteorology, 20-24 September 2004, Norfolk, VA, 12pp. – In Press. • Hoegh-Guldberg, O., M. Fine, W.J. Skirving, R. Johnstone, S. Dove, and A.E. Strong. Coral bleaching following wintry weather. Limnology and Oceanography., in press. • Liu. G., W. Skirving, O. Hoegh-Guldberg, and A. E. Strong, 2004. Potential for Poleward Expansion of Reef-Building Corals due to Climate Change. (Limnology and Oceanography, submitted). • Liu, G., W.J. Skirving, O. Hoegh-Guldberg, A.E. Strong. Potential for poleward expansion of reef-building corals due to climate change. Marine Ecology Progress Series, (in review). • Liu, G. and A.E. Strong, Coral Bleaching: A Threat to the Amazing Underwater Coral Reef World. In “Our Changing Planet: A View From Space.” M. King, K. Partington, R. Williams (eds.), Cambridge University Press, In press • Mumby, PJ, W. Skirving, A. Strong, J. Hardy, E. LeDrew, E. Hochberg, R. Stumpf, L. David, Remote sensing of coral reefs and their physical environment. Marine Pollution Bulletin – in press.
Other Milestones: Publications Journals Cont’d • Skirving, W.J. and K.J. Michael Development of a split window algorithm for retrieval of AVHRR SST in the Great Barrier Reef region. Journal of Geophysical Research (in review). • Skirving, W.J., K.J. Michael and M. Heron, A protocol for ship-borne measurements of radiometric sea surface temperature. IEE Transactions in Geoscience and Remote Sensing. (in review). • Skirving, W.J., K.J. Michael and M. Heron, Simulating ship-borne measurements of radiometric sea surface temperature. IEEE Transactions in Geoscience and Remote Sensing. (in review). • Skirving, W.J. and K.J. Michael Development of a split window algorithm for retrieval of AVHRR SST in the Great Barrier Reef region. Journal of Geophysical Research (in review). • Skirving, W.J., K.J. Michael and M. Heron, A protocol for ship-borne measurements of radiometric sea surface temperature. IEE Transactions in Geoscience and Remote Sensing. (in review). • Skirving, W.J., K.J. Michael and M. Heron, Simulating ship-borne measurements of radiometric sea surface temperature. IEEE Transactions in Geoscience and Remote Sensing. (in review). • Strong, A. E., G. Liu, J. Meyer, J. C. Hendee, D. Sasko. 2004. Coral Reef Watch 2002. Bulletin of Marine Science, 75(2), 259-268.
Other Milestones: Publications Satellites Reveal the Influence of Equatorial Currents and Tropical Instability Waves on the Drift of the Kon-Tiki in the Pacific” The influence of Tropical Instability Waves on phytoplankton blooms in the wake of the Marquesas Islands during 1998 and on the currents observed during the drift of the Kon-Tiki in 1947 Richard Legeckis and Christopher W. Brown of NOAA and Fabrice Bonjean and Eric S. Johnson of ESR Oceanography, December, Vol 17-4, 2004 Richard Legeckis and Christopher W. Brown of NOAA and Fabrice Bonjean and Eric S. Johnson of ESR Geophysical Research Letters, Volume-31, 2004
Other Milestones: Publications Presentations Presented at SPIE 4th International Asia-Pacific Symposium Ignatov, et al, 2004, Global diagnostics of operational AVHRR SST and aerosol retrievals from NOAA-16 and -17 (Honolulu, HI, Nov 04) (Oral) (Attached are two slides from this presentation. Note excellent consistency between N16/17 SSTs) Ignatov, et al, 2004, Consistency of two MODIS aerosol products on Terra and Aqua CERES SSF datasets (Honolulu, HI, Nov 04) (Oral) Ignatov, Laszlo, 2004, Equator crossing times for NOAA satellites (Honolulu, HI, Nov 04) (Oral) Ignatov, et al, 2004, In-flight measurements of space count in the AVHRR solar reflectance bands (Honolulu, HI, Nov 04) (Poster) Presented at AGU 2004 Fall Meeting Loeb, Manalo-Smith, Ignatov, Remer, 2004, Global top-of-atmosphere direct radiative effect of aerosols over ocean from merged CERES and MODIS observations for 2000-2003 (San-Francisco, CA, 13-17 Dec 2004) (Poster)