Download
1 / 1
10 likes | 938 Views
Aerial photo with interpretation Stereoscope used for interpretation PLANTS OF THE UPPER MISSISSIPPI RIVER SYSTEM Long Term Resource Monitoring Program Sampling Methods

E N D
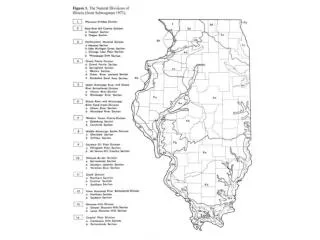
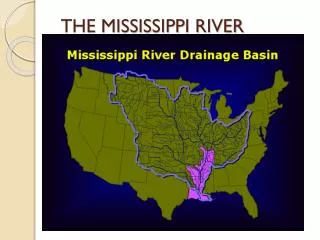
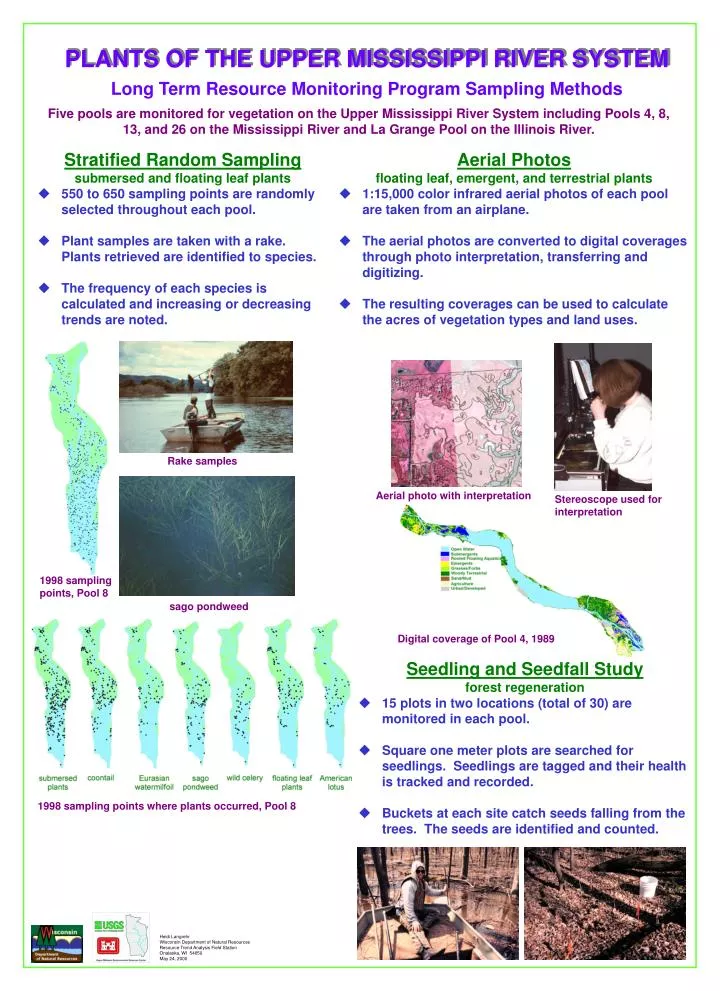
Aerial photo with interpretation Stereoscope used for interpretation PLANTS OF THE UPPER MISSISSIPPI RIVER SYSTEM Long Term Resource Monitoring Program Sampling Methods Five pools are monitored for vegetation on the Upper Mississippi River System including Pools 4, 8, 13, and 26 on the Mississippi River and La Grange Pool on the Illinois River. • Stratified Random Sampling • submersed and floating leaf plants • 550 to 650 sampling points are randomly selected throughout each pool. • Plant samples are taken with a rake. Plants retrieved are identified to species. • The frequency of each species is calculated and increasing or decreasing trends are noted. • Aerial Photos • floating leaf, emergent, and terrestrial plants • 1:15,000 color infrared aerial photos of each pool are taken from an airplane. • The aerial photos are converted to digital coverages through photo interpretation, transferring and digitizing. • The resulting coverages can be used to calculate the acres of vegetation types and land uses. white water lily and American lotus Rake samples 1998 sampling points, Pool 8 sago pondweed Digital coverage of Pool 4, 1989 • Seedling and Seedfall Study • forest regeneration • 15 plots in two locations (total of 30) are monitored in each pool. • Square one meter plots are searched for seedlings. Seedlings are tagged and their health is tracked and recorded. • Buckets at each site catch seeds falling from the trees. The seeds are identified and counted. 1998 sampling points where plants occurred, Pool 8 Heidi Langrehr Wisconsin Department of Natural Resources Resource Trend Analysis Field Station Onalaska, WI 54650 May 24, 2000