Download
1 / 31
310 likes | 442 Views
CP violation measurements with the ATLAS detector. “Determination of S and S from the Decay B S J/ ”. E. Kneringer – University of Innsbruck on behalf of the ATLAS collaboration BEACH2012, Wichita, USA. +. K +. J/. . -. K -. B S. p. p. Motivation.

E N D
CP violationmeasurementswiththe ATLAS detector “Determination ofSand S from the Decay BS J/ ” E. Kneringer – University of Innsbruck on behalf of the ATLAS collaboration BEACH2012, Wichita, USA
+ K+ J/ - K- BS p p Motivation • Main physics aim of this work of doing a time dependent angular analysis of BS J/ decays in ATLAS:Measurement of • CP violating weak mixing phase S • precise measurement of S • decay width difference between the mass eigenstates BH and BL which could point to BSM physics.
Outline • Introduction • CP violationand BSPhenomenology • ATLAS Detector • The Measurement • Angular Correlations • Unbinned Maximum Likelihood Fit • Results • Fit Projections • SystematicUncertainties • Comparisonwithother Experiments • Conclusions
CP violation and the CKM matrix • Unitarityof CKM matrix • constraintfrom 2ndand 3rdcolumns: Wolfensteinparametrization: The quantity sin(2S) can be determined from a time dependent analysis of BS J/. Experimenters prefer 2.
CP violation: neutral BS system • Interference of decays with and without mixing • Mixing induced CP violation • Phase difference S = 22 SM prediction: S = 0.0368 0.0018 rad s s K+ s K c + c b s t,c,u b + c S : This diagram justifies the name weak mixing phase. c W+ W s K+ s b t, c, u K
Phenomenology of the system • Mass eigenstatesBL,BH are linear combinations of flavor eigenstates: • CP violation BL,BHCP eigenstates • Two particle system described by 4 parameters • oscillation frequency mS = mH mL • mean widthS=(L+H)/2 • width differenceS = L H • weak mixing phaseS 0 if CP violation (plus nonperturbative parameters)
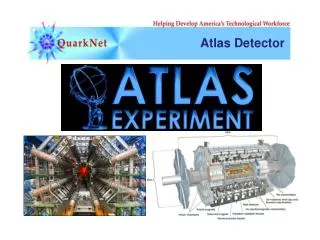
The ATLAS detector The ATLAS collaboration 38 Countries 185 Institutions 2866Scientific Authors every year:several new applicationsand expressions of interest for membership data used muon triggers
The measurement • Trigger • using 4.9 fb1 of data collected 2011 • events selected by muon triggers (single, di-, J/) • pT threshold for muons: 4 – 10 GeV • Selection cuts • different J/(+) mass windowsfor barrel/endcap regions • since mass resolution depends on || of muons • (K+K) invariant mass window: 22 MeV • pT (kaons) > 1 GeV • B-meson secondary decay vertex fit: 2/dof < 3 mass mi, proper decay time ti (computed in transverse plane), decay angles • Acceptance calculated on large samples of signal and background Monte Carlo events • e.g. B0 J/ K0*,bb J/ X, pp J/ X + J/ K+ K BS
and CP eigenstates • Analysis does not distinguish the initial states,i.e. whether there is a or a at the beginning = “untagged analysis” • Both initial states decay into the same final state • final state is a superposition of CP eigenstates • J/, (JPC = 1- -,1- -) can have L = 0,1,2 Pseudoscalar Vectormeson + Vectormeson, with relative L orbital angular momentum: L = 0,2 … CP even (+1) L = 1 … CP odd (1) • CP eigenstates of final state can be distinguished (statistically) through their angular configuration • 4 particle final state J/( +) ( K+K) can be described by three angles
Kinematics of the decay • Transversity basis • x-axis = direction of decay in B rest frame • x-y plane = decay plane of K+K (K+ +y) • T = angle between x-axis and K+ direction ( r.f.) • T and T are the polar and azimuthal angles of the + in the J/ rest frame plots byS. Palestini Transversity angles (= T,T, T)are used to describethe angular distributions of the different CP (+1,-1) final states.
Angular and proper time distributions • Differential decay rate polarizationstate long. trans. trans. CP +1 +1 1 interference terms Terms related tonon-resonantand via the f0 state K+Kproduction(S-wave) small Normalization: |A0(0)|2 + |A||(0)|2 + |A(0)|2 + |AS(0)|2 = 1Each amplitude AX comes with its strong phase X.Define strong phases relative to A0(0): choose 0 = 0 3 amplitudes + 3 strong phases = 6 parameters for the fit! sinS S cosS= 1 + O(S2)
Symmetries • Senters the likelihood via the 10 functions describing the proper decay time distribution,e.g. terms: f(S) cos( ||) sinS escosS e+scosS • Likelihood is invariant under the transformations {S, , ||, S, S} {S, , ||, S, S} but also {S, , ||, S, S} { S, , ||, S, S} and the combination of the two. • 4-fold symmetry of the fit result • ATLAS is not yet able to resolve the ambiguities S (-1) (-1) S S needs external input
Construction of the Likelihood function • Measured variables () • (mi, mi), (ti,ti),i, • set of nuisance parameters to describe background • 27 parameters in the full fit () • 9 physics parameters • 3 parameters of the ,system (not mS) • 3 transversity amplitudes |A0|, |A|||, |AS| • 3 strong phases , ||, S • signal fraction fS number of signal events • parameters describing various distributions • the J/ signal mass distribution, angular background distributions, estimated decay time uncertainty distributions for signal and background events, scale factors
Result of the fit: fit projections BS meson mass proper decay time 22700 evts • S = L H
Fit projections – transversity angles Important for measuring the absolute values of the transversity amplitudesA0, A||, A, AS.
Systematic uncertainties • Theyarecalculatedusingdifferent techniques, includingchanges in detectorsimulation (alignment), databasedstudies(efficiency), Monte Carlo pseudo experiments(massmodels) andvariations in analysismethodsandassumptions.
Results of the fit in numbers • Statistical error for S rather large because of limited proper decay time resolution of ATLAS • but still competitive with Tevatron results
& correlation matrix • LargestcorrelationbetweenSand S • BSmesonparametersarepracticallyuncorrelatedwiththeamplitudes.
Likelihood contours: S-S plane Agreement with the Standard Model prediction!
Conclusion • From 4.9 fb1 of data collected by ATLAS in 2011 decay time and angular distributions have been studiedin a sample of 22700 J/ decays. Without flavor tagging, and assuming = 2.95 ± 0.39 rad the results of the analysis are: • Future: • Plan to implement flavor tagging (distinguish ) • Increased data sample in 2012 (~ factor 3 is realistic),but fewer events /fb1 (due to increased pT cuts);expect to half our statistical errors.
References • SM expected values for S, S • UTFit Collaboration, PRL 97, 151803 (2006) • Decay time an angular correlation formalism • A. Dighe, I. Dunietz, R. Fleischer, EPJ-C 6 (1999) 647 • Results from other experiments (LHCb, CDF, D0) • CDF Collaboration: CDF-Public-Note-10778 • D0 Collaboration: PRD85, 032006 (2012) • LHCb Collaboration: LHCb-CONF-2012-002; PRL 108, 101803 (2012); PRL 108, 241801 (2012) • This ATLAS analysis • ATLAS Collaboration, ALTAS-CONF-2012-xxx
ATLAS result on strong phases Input: Likelihood fit:
Maximum Likelihood fit Gaussian constraint signal: angular sculpting 10 O(k)-functions background:
Uncertainty distributions Ps,b(m,t) Massanddecay-time measurementsenterthelikelihoodwithevent-by-event uncertainties. The errordistributionsareextractedfromdata.Checks done nosignificantsystematics. Same for: Proper decay time uncertainty distribution. Mass uncertainty distribution from data,the fits to the background an the signal fractions and the sum of the two fits.
Comparision of measurements • compiled by S. Palestini
New Physics in mixing • Would change the off-diagonal element M12 of the mass matrix (but not significantly affect the corresponding decay matrix element 12) • parametrization: • correction adds linearly to the weak phase,like in • for small S only contributes quadratically toS: • magnitude measurable through oscillation frequency: