Download
1 / 22
220 likes | 356 Views
Characterization of Dissolved Solids in the Ohio River. Technical Committee October 8-9, 2013. Background. Commission adopted 500 mg/L standard for TDS in June 2011 Rivers Users Program developed study to investigate TDS and major ions

E N D
Characterization of Dissolved Solids in the Ohio River Technical Committee October 8-9, 2013
Background • Commission adopted 500 mg/L standard for TDS in June 2011 • Rivers Users Program developed study to investigate TDS and major ions • Water Users simultaneously proposed similar study for bromide • Integrated the two study designs for cost efficiencies and more robust data set
Study Objectives • Characterize ambient background levels of TDS • Quantify TDS constituent makeup to evaluate seasonal and spatial variability • Develop site-specific translators to convert conductivity to TDS • Provide data to support possible development of an Ohio River bromide stream criterion
Sampling Design • Weekly samples collected at 16 sites • Collection sites located at water intakes • Participants identified through the WUAC and PIAC • Sampling conducted for 1-year • December, 2011 thru December 2012 • Analysis – In-house and contract lab
Analysis • pH • Conductivity • Temperature • Stream flow Dissolved Solids Analytes Supplemental Parameters • Chloride • Sulfate • Bromide • Fluoride • Bicarbonate • Total Dissolved Solids Sodium Potassium Magnesium Calcium Lithium
What do the results tell us about ambient levels of TDS? • Peak concentration in Ohio River was 368 mg/L • Median level 215 mg/L • Highest levels on Muskingum and Big Sandy Rivers • 584 mg/L and 579 mg/L respectively
Are there seasonal variations? • Highest concentrations observed in late Aug./early Sept. • Stream flow is major driver of temporal variation • Concentrations of TDS and most ions are inversely correlated with Q • All OR samples well below 500 mg/L std., even during low flow
What are the major ions? • 5 ions makeup 93% of TDS in Ohio River • Sulfate, bicarbonate, calcium, chloride, sodium • Bromide is typically <0.05% • BUT, not insignificant!
How does ionic composition vary spatially? • SO4 decreases from upstream to down • 36% at mile 12 to 21% at mile 978 • Beaver R. 19%; Big Sandy 42% • HCO3 doubles from 19% in Pittsburgh to 38% in Cairo • Calcium remains fairly consistent (13-16%) • Cl- shows general decline from 14.5% at mile 137 to 8.8% at mile 792 • Big Sandy 4%; Beaver R. 19% • Sodium decreases moving downstream • 11% in Pittsburgh to 7% in Cairo • Bromide generally highest in upper river
What are the implications of the ion composition on the regulation of dissolved solids? • TDS standard is 500 mg/L • Note: This study does not address appropriateness of numeric value • ORSANCO has standards for two individual ions • Sulfate – 250 mg/L; chloride – 250 mg/L • Sulfate and chloride combined account for 43% of TDS • Sulfate – 31%; chloride – 12% • Since the sum of the standards for SO4 and Cl are equal to the standard for TDS, it is possible to not exceed the individual ion criteria and yet have TDS levels well above 500 mg/L. • Therefore, indirectly regulating TDS through SO4 and Cl alone is not sufficient to ensure TDS levels remain below 500 mg/L.
What is the relationship of TDS and conductivity in the Ohio River? • Conductivity sometimes used as surrogate for TDS • 0.67 is commonly used to convert conductivity to TDS • Reported conversion factors range from 0.5 to nearly 1 • Conv. factor depends on ionic composition • Compared TDS to specific conductance • Ohio River conversion factors ranged from 0.55 to 0.58 • Could overestimate TDS by 20% using 0.67 conv. factor.
Comparison of Bromide to THMs • Compared THMs in finished water to bromide levels in source water • Challenges: • Most plants only collect THM data quarterly • Limits number of paired data sets for comparison • Many non-detects for bromide, especially early in study period • Further limits paired data • Lag time between raw water sample collection and travel time through treatment plant • Not all utilities collect THMs on plant effluent
How does bromide in source water compare to TTHMs in finished water? • Bromide vs TTHMs compared across all sites • Bromide: 40 to 150 ug/L • TTHMs: 10 to 130 ug/L • No clear pattern when all sites grouped together • Highest bromide values did not correspond to highest TTHMs
How does bromide in source water compare to TTHMs in finished water?
General Bromide/THM Observations • Hays Mine experienced highest TTHM levels • No clear relationship with bromide • Wheeling’s only TTHM sample over 80 ug/L corresponded to a non-detect for bromide • Cincinnati and Cairo had very low TTHM levels, even at higher bromide concentrations • PWSA data comparison showed the strongest positive correlation between bromide and TTHMs • Brominated THMs relative abundance greater with higher bromide levels • Large # of variables make it difficult to compare across utilities • However, many individual sites had insufficient data to discern relationship • Need more intensive monitoring to evaluate relationship between bromide and THMs.
General Bromide/THM Observations • Results inconclusive to define relationship between bromide and THM formation • High bromide levels did not consistently correlate with high THM concentrations • PWSA data comparison showed the strongest correlation between bromide and TTHMs • % brominated THMs greater with higher bromide levels • Large # of variables make it difficult to compare across utilities • However, many individual sites had insufficient data to discern relationship • Need more intensive monitoring to evaluate relationship between bromide and THMs.
Comments Received • Dissolved solids report distributed to 4 committees for review and comment: • Technical Committee • ORSANCO/Ohio River Users Advisory Committee • Water Users Advisory Committee • Stream Criteria Subcommittee • Received responses from 10 individuals
Summary of Comments • General comments • Various spelling/grammatical edits • Specific conductance/TDS relationship • Need to more clearly state recommendation regarding use of specific conductance to TDS conversion factors • Bromide • Need to highlight data limitations in comparing bromide to THMs • Correlation of bromide to flow by site may help differentiate natural vs man-made sources • Correlation to TTHMs is flawed; many other contributing factors • TDS not the right parameter to limit bromide. May need to develop bromide standard once relationship to THM formation is better understood. • Need more site specific data to evaluate potential need for ambient water quality criterion
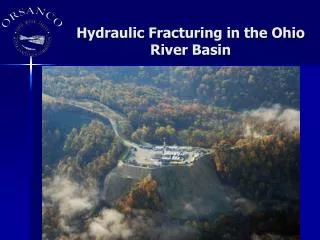
Summary of Comments (cont) • TDS • Should look at TDS loadings by site • Add coefficient of variability to table of TDS results • Did TDS result ever exceed sum of ions? • Should mention potential impact from frack water disposal • Ion Composition • How were the ion-specific percentages calculated? • Implications to WQ Standards • Report is on monitoring results, not toxicity or adverse effects. Do not see how report on ambient conditions warrants revisiting a WQS. • Do not agree with statement that stand-alone TDS standard is necessary (x2) • Supports need for stand alone TDS standard
TEC Action Options: Recommend Commission approve report Direct staff to make revisions; bring back for consideration at February meeting