Download
1 / 21
210 likes | 330 Views
Estimados Expositores del II Seminario de Electricidad Consequences of increasing penetration of distributed generation on transmission and distribution grids. Structure. Distributed Generation sources Wind Photovoltaik Hydro Biomass Geothermal CHP

E N D
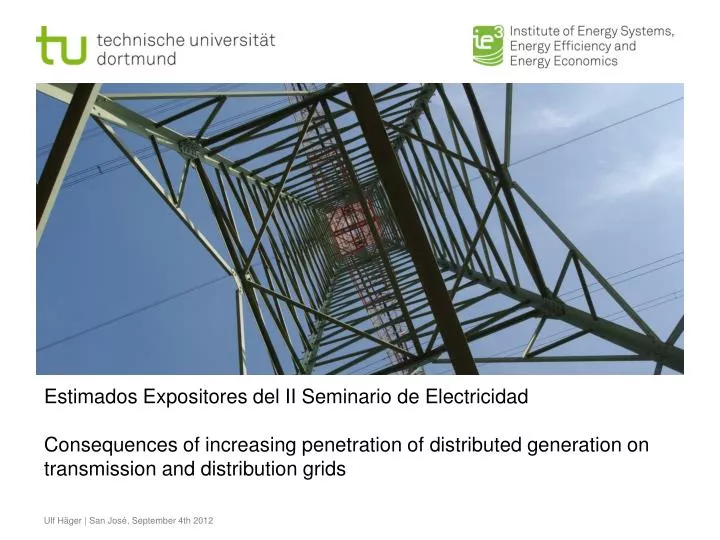
Estimados Expositores del II Seminario de ElectricidadConsequences of increasing penetration of distributed generation on transmission and distribution grids Ulf Häger | San José, September 4th 2012
Structure Ulf Häger | San José, September 4th 2012 • Distributed Generation sources • Wind • Photovoltaik • Hydro • Biomass • Geothermal • CHP • Consequences for transmission and distribution grids • Balance Power • Transmission Grids • Distribution Grids
Histogramm ofthe nominal power of Onshore Wind Power Plantsinstalled in Germany in 2010: Wind • Fact Sheet: • Stand-alone-devices: • Are usually connected to MV or HV • Parks: • Small parks are usually connected to MV or HV, while large parks are connected to HV or the transmission system On-shore Off-shore • Fact Sheet: • Offshore parks are usually connected to the transmission system • Submarine Cable (AC or DC) is necessary between offshore park (Ppark usually more than 100 MW) and connection point Ulf Häger | San José, September 4th 2012
Typesof Distributed Generation • Fact Sheet: • PV plants with nominal power < ~300 kW are connected to LV • PV plants with nominal power between ~300 kW and ~15 MW are connected to MV • PV plants with nominal power > ~15 MW are connected to HV Photovoltaik Histogramm ofthe nominal power of Photovoltaik plantsinstalled in Germany in 2010: Ulf Häger | San José, September 4th 2012
Typesof Distributed Generation River • Fact Sheet: • Often large power plantsconnectedtothetransmissionsystem • Also smallerdistributedgeneratorsavailablewhichareconnectedto LV, MV or HV Hydro Pump-storage • Fact Sheet: • Often large power plantsconnectedtothetransmissionsystem • Also smallerdistributedgeneratorsavailable, usuallyconnectedto HV • Fact Sheet: • Different types: • Tidal power • Marine current power • Wave power • … • All are still prototypes Marine Ulf Häger | San José, September 4th 2012
Typesof Distributed Generation • Fact Sheet: • Fuel types: Firewood, Pellets, Bio oil, Bio gas, Bio ethanol • Can also provide thermal power (CHP) • Can be used as base load Biomass Histogramm ofthe nominal power of Photovoltaik plantsinstalled in Germany in 2010: Ulf Häger | San José, September 4th 2012
Typesof Distributed Generation • Fact Sheet: • Exploitationof high watertemperaturesunderground (>100°C) • Nominal power usuallyupto 10 MW • Can beusedtoprovide thermal power (CHP) Geothermal • Fact Sheet: • Typicaldevices: • Stirlingmotor • Microgasturbine • Piston engine • BHKW CHP Ulf Häger | San José, September 4th 2012
Main sources of distributed generation Fluctuating Controllable Biomass Photovoltaik Pump-storage Hydro Marine Geothermal River Wind CHP On-shore Off-shore Ulf Häger | San José, September 4th 2012
Structure Ulf Häger | San José, September 4th 2012 • Distributed Generation sources • Wind • Photovoltaik • Hydro • Biomass • Geothermal • CHP • Consequences for transmission and distribution grids • Balance Power • Transmission Grids • Distribution Grids
Szenario 2040+ Goal in Germany:80% renewable Generation until 2050 Electricity demand Balance power between +35 GW and -24 GW by: - Peak load power plants - Storages - Import of renewable Energy - Demand Side Management Severe transmission network reinforcement Reinforcement and operation of distribution networks: - Smart Market - Smart Grid Source: own Studies + BMU: DLR "BMU Leitszenario 2009" Ulf Häger | San José, September 4th 2012
Szenario 2040+ Goal in Germany: 80% renewable Generation until 2050 Balance power between +35 GW and -24 GW by: - Peak load power plants - Storages - Import of renewable Energy - Demand Side Management Severe transmission network reinforcement Pump storage in Germany today: 7,5 GW, 45 GWh Demand 2040+: 35 GW => 1.750 GWh Reinforcement and operation of distribution networks: - Smart Market - Smart Grid Ulf Häger | San José, September 4th 2012
Future scenarios with large amount of renewable energies require flexible loads (storage capability) Balanced via European Electricity Market and Transmission Network Load or Consumption Centers in highly Populated Areas Renewable Energy Ressources primarily in Rural Areas Last- bzw. verbrauchsgeprägte städtische Gebiete Erneuerbare Energien geprägte ländliche Gebiete Last- bzw. verbrauchsgeprägte städtische Gebiete Erneuerbare Energien geprägte ländliche Gebiete Source: TU Dortmund + ABB Ulf Häger | San José, September 4th 2012
Szenario 2040+ Goal in Germany: 80% renewable Generation until 2050 Future offshore wind parks Balance power between +35 GW and -24 GW by: - Peak load power plants - Storages - Import ofrenewableEnergy - Demand Side Management • Transmission networkreinforcement (2040+) • at least 3000 km lines(380 kV+ maybeHVDC) • costs min 6 - 8 bilEuro 2040+ • correspondstoapprox. 0,25 - 0,35 ct / kWh • additional wind generation Load centers Severetransmissionnetworkreinforcement Reinforcement and operation of distribution networks: - Smart Market - Smart Grid Verteilnetzausbau und -betrieb Source: TU Dortmund Ulf Häger | San José, September 4th 2012
PMU PMU PMU PMU PMU PMU PMU PMU PMU PMU PMU PMU PMU PMU PMU PMU PMU PMU PMU PMU PMU PMU PMU PMU Vision: WAMS & WACS Dynamic State Model Stability Information Network Control & System Protection Ulf Häger | San José, September 4th 2012
Szenario 2040+ Goal in Germany: 80% renewable Generation until 2050 ... Balance power between +35 GW and -24 GW by: - Peak load power plants - Storages - Import ofrenewableEnergy - Demand Side Management Increasing shareof DG Severetransmissionnetworkreinforcement - - - - - - - - - - - - ... ... ... New loadsandloadmanagement ... ... Reinforcement andoperationofdistributionnetworks: - Smart Market - Smart Grid - - - - - - - - - - - - - - - - - - - - - - x x - - Source: TU Dortmund + RWE + Mennekes Ulf Häger | San José, September 4th 2012
Distribution grids reach limits of capacity and voltage due to renewable generation and new controllable load applications ... DG Increasing share of DG Voltage / V new Loads New loads and load management - - - - - - - - - - - - ... Time / h Source: TU Dortmund RWE Deutschland AG ... ... ... ... - - - - - - - - - - - - - - - - - - - - - - x x - - Implementation of innovative devices, grid and operation/control concepts Ulf Häger | San José, September 4th 2012
Demand of network reinforcement results from Smart Grid und Smart Market requirements Smart Grid Smart Market • The design of future grids must jointly consider Operation, Asset Management und Planning according to the requirements of Smart Grids und Smart Markets. • Demand of network reinforcement and the corresponding regulatory consequences must be investigated for the future based on these boundary conditions. Grid / System Operation Asset Management (Investment) Grid planning Ulf Häger | San José, September 4th 2012
Coordinated use of voltage control and reactive power management Smart Grid • direct voltage control • indirect voltage control STATCOM, Tap Changer Storage HS/MS Q - Management - - - - MS-AVC ... - - - - SVC ... - - - - ... - - - - ... Tap Changer Trafo + AVC STATCOM, Storage ... - - - - ... - - - - Q - Management - - - - NS-AVC - - - - - - - - x x MS/NS Ulf Häger | San José, September 4th 2012
Aggregator bundels loads/gen. and providessystem services or market products Smart Market E-Energy Market Place Grid Operator Aggregator Demand Response Demand Side Mgmt Supply Side Mgmt. Electricity Market Energy Supplier Energy Trader System Services Network Restrictions HV/MV Prosumer (active custromer) Data Daten Micro - - - CHP Gas Gas Electricity Strom MV/LV Ulf Häger | San José, September 4th 2012
Szenario 2040+ Goal in Germany: 80% renewable Generation until 2050 • Integration of Distributed Generation requiresmodificationstothe power system Balance power between +35 GW and -24 GW by: - Peak load power plants - Storages - Import ofrenewableEnergy - Demand Side Management • Integrated considerationofmeasures in all fieldsof power systemoperationandplanningisnecessary • Investigationsarerequiredtodeterminetheoptimumsharebetweennetworkreinforcementorother Smart Gridand Smart Market measures Severetransmissionnetworkreinforcement Reinforcement andoperationofdistributionnetworks: - Smart Market - Smart Grid Verteilnetzausbau und -betrieb Ulf Häger | San José, September 4th 2012
Thankyouforyourattention! Ulf Häger | San José, September 4th 2012