Download
1 / 10
100 likes | 249 Views
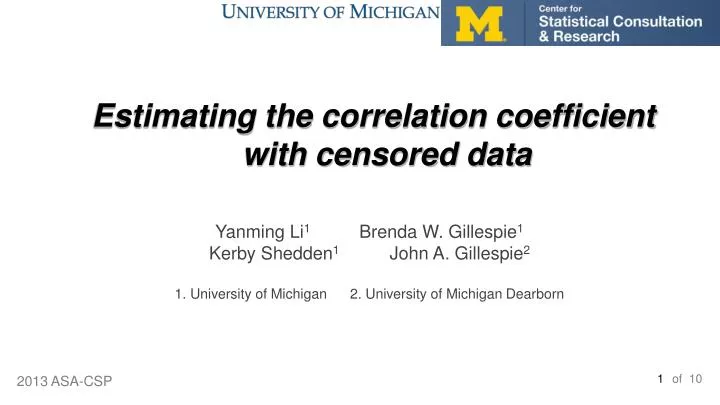
Estimating the correlation coefficient with censored data. Yanming Li 1 Brenda W. Gillespie 1 Kerby Shedden 1 John A. Gillespie 2 1. University of Michigan 2. University of Michigan Dearborn. Motivation.

E N D
Estimating the correlation coefficient with censored data Yanming Li1 Brenda W. Gillespie1 Kerby Shedden1 John A. Gillespie2 1. University of Michigan 2. University of Michigan Dearborn of 10
Motivation • A study on Belgian barn owls* aimed at investigating how chemical concentrations of perfluoroalkyl substances (PFASs) and perfluorooctane sulfonate (PFOS) in tail feathers and other soft tissues are correlated. • Statistical methods for censored data with user-friendly interfaces are needed to cope with levels below the limit of detection (LOD). Some examples of using our novel method and R package analyzing the Belgian barn owl data: • Left panel: A scatter plot showing fully observed data, censored (left and interval censored) data, and partially missing data. • Right panel: profile likelihood function for the correlation coefficient, showing the point estimate and the 95% confidence interval. * Perfluoroalkyl substances in soft tissues and tail feathers of Belgian barn owls using statistical methods for left –censored data to handle non-detects. Veerle J. et al, Environment International 53(2013) 9-16. of 10
Outline • Estimating the correlation coefficient for bivariate Gaussian data with censoring or/and missing. • Using parametric likelihood-based inference. • Presenting an R package capable of handling different types of censoring (left, right, interval and mixtures of those types). • Presenting ways of making scatterplots with censored bivariate data and graphing the profile likelihood function. of 10
Censored Data: Their Likelihood, Maximum-likelihood Estimation and Confidence Interval Estimation • Likelihood (for left censored data only, o=observed, c=censored) * both x & y censored complete data x censored, y observed x observed, y censored • Construct confidence interval via likelihood ratio tests log profile likelihood fixed at marginal maxima and a confidence interval with coverage probability is the set chi-square critical value of 10 * assumes missing completely at random and random censoring.
The R package: ClikcorrCensored data likelihood based correlation inference • Output • Maximized likelihood estimate of the correlation coefficient • Input data format • Estimated bivariate variance covariance matrix • Estimated means • Syntax to run the main estimating function • p-value for likelihood ratio test with null hypothesis r=0 • Lower bound of the CI Clikcorr(Data, "L1", "U1", "L2", "U2", cp=.95) L1, U1: Lower and upper bounds for the 1st variable L2, U2: Lower and upper bounds for the 2nd variable cp: Coverage probability of the confidence interval • Upper bound of the CI • log likelihood value at MLE of 10
The R package: Graphics Clikcorr.scatterPlot(Data, c("L1","L2","L3"), c("U1","U2","U3")) Clikcorr.profilePlot(Data, "L1", "U1", "L2", "U2", cp=0.95) of 10
Results From Simulated Data Table 1: 95% Confidence interval coverage probabilities for different censoring proportions Coverage probabilities are estimated from 500 replications. * Coverage probabilities in parentheses are calculated from Fisher transformation in the case of no censoring. Table 2: Run time (seconds) for different settings of r, n and censoring percentages of 10
Results From Simulated Data Table 3: Bias (MSE) for normally distributed detection limits, where data are simulated from an independent N(0,1) distribution Bias and MSE are estimated from 50 replications. of 10
Sensitivity to Misspecification Table 4: 95% confidence interval coverage probabilities of bivariate normal estimates for bivariate t generated data • Coverage probabilities are estimated from 500 replications. of 10
CSCAR at the University of Michigan The Center for Statistical Consultation and Research (CSCAR) provides support and training to University of Michigan researchers in a variety of areas relating to the management, collection, and analysis of data. CSCAR also supports the use of technical software and advanced computing in research. Find us at: http://www.cscar.research.umich.edu/about/ • Yanming Li, Graduate Student Research Assistant. liyanmin@umich.edu • Kerby Shedden, CSCAR Director. kshedden@umich.edu • Brenda W. Gillespie,CSCAR Associate Director. bgillesp@umich.edu • John A. Gillespie, Professor of Mathematics and Statistics, University of Michigan Dearborn. jgillesp@umd.umich.edu of 10