Download
1 / 21
210 likes | 431 Views
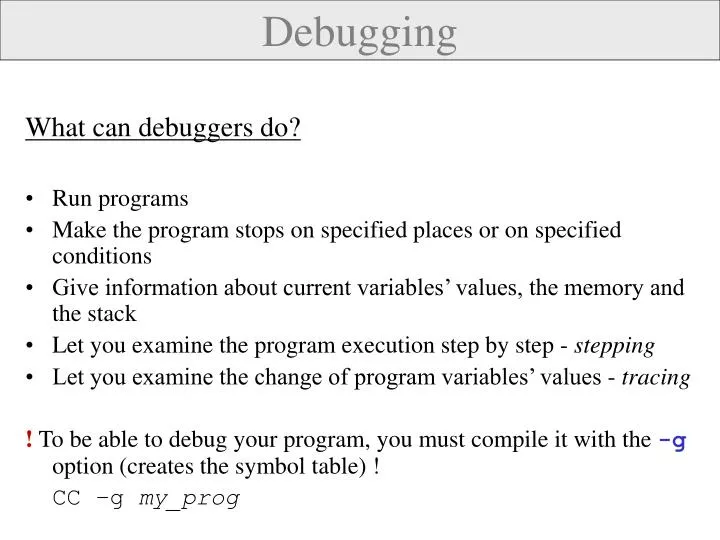
Debugging. What can debuggers do? Run programs Make the program stops on specified places or on specified conditions Give information about current variables’ values, the memory and the stack Let you examine the program execution step by step - stepping

E N D
Debugging What can debuggers do? • Run programs • Make the program stops on specified places or on specified conditions • Give information about current variables’ values, the memory and the stack • Let you examine the program execution step by step - stepping • Let you examine the change of program variables’ values - tracing ! To be able to debug your program, you must compile it with the -g option (creates the symbol table) ! CC –g my_prog
GDB - Freeware GNU Debugger Start GDB and load the symbol table in one step: gdb my_prog Starting GDB: gdb Loading the symbol table: file my_prog /my_prog is executable file name!/ Exit GDB: quit Executing shell commands:shell command args make is a special case: make args
GDB – Commands • Command names may be truncated if the abbreviation is unambiguous: s (for step), r (for run) • UNIX style TAB completion for the command names. • Alternative way: completechars. Ex.:completeh results in: handle hbreak help • Getting help: help (or h) – lists all classes of commands. h command - displays a short description of the command
GDB – Running Programs Running a program: run (or r) -- creates an inferior process that runs your program. • if there are no execution errors the program will finish and results will be displayed • in case of error, the GDB will show: - the line the program has stopped on and - a short description of what it believes has caused the error There is a certain information that affects the execution of a program: • program’s arguments • program’s environment • program’s working directory • the standard input and output
GDB – Program’s arguments Specifying arguments for your program: • As arguments to run: run arg1 arg2 … • Withset args command: set argsarg1 arg2 … ! run without arguments uses the same arguments used by the previous run. !set args without arguments – removes all arguments. !show args command shows the arguments your program has been started with.
GDB – Program’s environment Changing the PATH environment variable: pathdir – add the directory dir at the beginning of the PATH variable. You may specify several directory names separated by ‘:’ or white space. show paths – displays the search paths for executables. Changing the working directory: cddir – to change the working directory Redirecting output: run >outfile direct the output to the file outfile.
GDB - Debugging an already-running process From inside GDB: attachprocess-id / To get the process ID use the UNIX command ps / From outside GDB: gdbmy_progprocess-id ! The first thing GDB does after arranging to debug the specified process is to stop it. detach – detaches the currently attached process from the GDB control. A detached process continues its own execution.
GDB – Breakpoints and watchpoints Breakpoints and watchpoints allow you to specify the places or the conditions where you want your program to stop. breakarg – stops when the execution reaches the specified line / arg – function name, line number, +/- offset / watchexpr – stops whenever the value of the expression changes clear [arg] Without arguments deletes any breakpoint at the next instruction to be executed in the current stack frame delete [bnum] Without arguments deletes all breakpoints.
GDB – Examining variables ! Global variables can be examined from every point in the source file. ! Local variables – can be examined only in their scope or using: file::variable or function::variable The variable type:ptypevar Current value:printvar Automatic display: display var - adds var to the automatic display list. undisplaydnum ___________________________________________________ Specifying the output format (x, o, d, u, t, a, f, and c) : print /tvar - prints the value of var in binary format
GDB – Value history The value history keeps the values printed by the print command. Previously printed values can be accessed by typing $ followed by their history number. $ - refers to the most recent value and $$n - refers to the n-th value from the end. show values [n|+] Without argument – the last 10 values. n – 10 values centered around n + – 10 values after the last printed
GDB – Stepping through the program step [count] – program execution continue to next source line going into function calls. next [count]– program execution continue to the next source line omitting function calls. continue– resume program execution until – continue until the next source line in the current stack frame is reached. /useful to exit from loops/
GDB – Altering execution Returning from a function finish - forced return return [ret_value] – pops the current stack frame Continuing at different address jumpline_num|*address Altering the value of a variable seti=256 Proceeding to a specified point: until [line_num|*address |function_name]
GDB – The stack frame Stack frames are identified by their addresses, which are kept in the frame pointer register. • Selecting a frame: • framen|addr • upn • downn • Information about the current frame • frame – brief description • info args – shows function arguments • info locals – shows local variables 0 1 2
GDB – Convenience variables • Convenience variables are used to store values that you may want to refer later. Any string preceded by $ is regarded as a convenience variable. Ex.:$table = *table_ptr • There are several automatically created convenience variables: $pc – program counter $sp – stack pointer $fp – frame pointer $ps – processor status $_ - contains the last examined address $__ - the value in the last examined address $_exitcode - the exit code of the debugged program
DDD - The Data Display Debugger • DDD is a GUI debugger that can work with several inferior debuggers including GDB. • GDB commands can be typed in the debugger console window. • DDD sets some GDB settings automatically and will not work correctly if you change them. These are: set height0 set width0 set verboseoff set prompt(gdb) !
DDD – View argument field source window debugger console command tool
DDD –GUI Advantages • Frequently used commands are on the toolbars, have assigned shortcut keys or can be done just with a mouse click. • Easy browsing through the source ! • Examining current variables values directly – by placing the mouse pointer over them. • Possibility to graphically display the program data. • Help menu – What now? – very helpful !
GDB – Examining memory The x command (for “examine”): • x/nfu addr – specify the number of units (n), the display format (f) and the unit size (u) of the memory you want to examine, starting from the address addr. Unit size can be – b, h (half), w and g (giant). • x addr– start printing from the address addr, others default • x – all default Registers Registers names are different for each machine. Use info registers to see the names used on your machine. GDB has four “standard” registers names that are available on most machines: program counter, stack pointer, frame pointer and processor status.
GDB – Additional process information info proc – summarize available information about the current process. info proc mappings – address range accessible in the program. info proc times – starting time, user CPU time and system CPU time for your program and its children. help info ! info signals– information about the system signals and how GDB handles them.
Questions 1. How you create a symbol table? 2. How you load the symbol table of a program to GDB? 3. Where breakpoints can be set? 4. How many breakpoints can be set for a program? 5. Which command(s) can be used to exit from loops? 6. Which command goes into function calls? 7. What causes segmentation faults and bus errors? 8. What programming errors cause access to forbidden memory addresses? 9. Which memory addresses are forbidden?