Download
1 / 9
100 likes | 330 Views
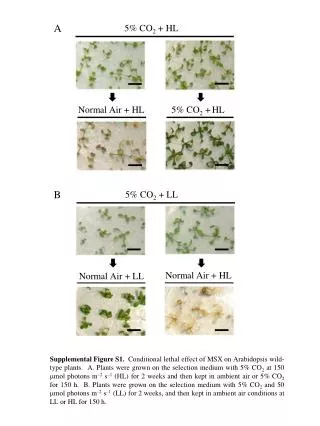
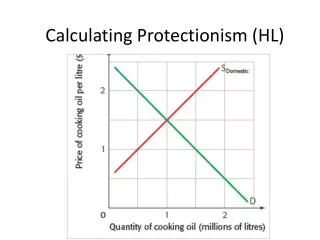
Calculating Protectionism (HL). Let’s look at the domestic market for cooking oil and tariffs. 1. Indicate the domestic equilibrium price and quantity on the graph . 2. Cooking oil may be imported. The world price is 30 ¢ per litre. Add the world supply curve to the graph .

E N D
Let’s look at the domestic market for cooking oil and tariffs. • 1. Indicate the domestic equilibrium price and quantity on the graph. • 2. Cooking oil may be imported. The world price is 30 ¢ per litre. Add the world supply curve to the graph. • 3. Explain how much cooking oil will be supplied by domestic suppliers and how much will be supplied by foreign producers when free trade takes place. • 4. The government imposes a tariff of 15¢ per litre. Show the effect of this on the graph. • 5. Calculate the change in consumer spending before and after the imposition of the tariff. • 6. Calculate the government tax revenue after the tariff is put in place. • 7. Explain the impact of the tariff on any two of the stakeholders in the cooking oil market.
Calculating Protectionism: Tariff • Domestic producer’s revenue before tariff: • PW xQD= • 30x60=180$ • Domestic producer’s revenue after tariff: • PT x Q newD= • 45 x 90 =405$
Calculating Protectionism: Tariff Foreign producers receive the world price of 30$, but imports are reduced from 120 to 60 units • Foreign producer revenue before tariff: • PW x Q import= 30 x (180 -60) =3600$ • Foreign producer revenue after tariff: • PW x Q new import= 30 x (150 -90) =1800$
Calculating Protectionism: Tariff Consumer Surplus is calculated as the area of the consumer surplus triangle, ½ (b x h) • Consumer Surplus before tariff: • ½ (highest price – PW) x QW = • 0.5 (120-30) x 180=8100$ • Consumer Surplus after tariff: • ½ (highest price – PWT) x QW = • 0.5 (120-45) x 150=5625$
Calculating Protectionism: Tariff Government revenue is calculated as the amount of tariff multiplied by the number of imports. • Government revenue before tariff: • 0= no tax collected • Government revenue after tariff: • (PT-PW) x Q new imports = • (45-30) x (150-90)= 900$
Calculating Protectionism: Tariff The two blue triangles represent the net loss of social welfare resulting from the tariff. • Welfare loss of tariff= • 2 (0.5(30 x 15)) = • 2 x 225= 450$
Domestic market for cooking oil and tariffs. • Domestic producers are able to sell more, at a higher price, thus increasing revenue and, in all probability, profit. They will also increase employment, which should be good for the domestic economy. Foreign producers sell less, at the same price, thus reducing their revenue and, almost certainly, their profit. This will also lower employment in the foreign economies, causing damage there. • Consumers get to consume less of the product, at a higher price, in this case paying more in total. They also suffer a loss of consumer surplus, some to domestic producers, some to the government, and a dead-weight loss, shown by the light blue triangle in the diagram. • The government will gain income from the tariff, which may then be, spent. The government may also benefit from a decrease in unemployment in the economy. However, there is always the danger ofretaliation from other countries for imposing the tariff. • Resource allocation in this case means that production of 30 million litres of cooking oil shifts from efficient foreign producers to less-efficient domestic producers. This is a welfare loss and inefficient resource allocation occurs, shown by the dark blue triangle in the diagram.