Download
1 / 11
110 likes | 230 Views
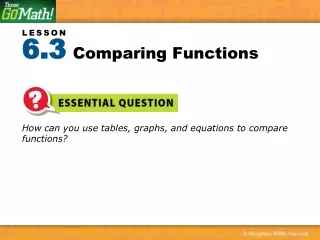
Comparing Functions. Essential Questions. How do we compare properties of two functions? How do we estimate and compare rates of change?. Holt McDougal Algebra 2. Holt Algebra 2.

E N D
Comparing Functions Essential Questions • How do we compare properties of two functions? • How do we estimate and compare rates of change? Holt McDougal Algebra 2 Holt Algebra 2
The graph of the exponential function y = 0.2491e0.0081x approximates the population growth in Baltimore, Maryland.
The graph of the exponential function y = 0.0023e0.0089x approximates the population growth in Hagerstown, Maryland. The trends can be used to predict what the population will be in the future in each city. In this lesson you will compare the graphs of linear, quadratic and exponential functions.
Helpful Hint Remember to find the average rate of change over a data set, find the slope between the first and last data point.
Comparing the Average Rates of Change of Two Functions George tracked the cost of gas from two separate gas stations. The table shows the cost of gas for one of the stations and the graph shows the cost of gas for the second station. Compare the average rates and explain what the difference in rate of change represents.
Comparing the Average Rates of Change of Two Functions George tracked the cost of gas from two separate gas stations. The table shows the cost of gas for one of the stations and the graph shows the cost of gas for the second station. Compare the average rates and explain what the difference in rate of change represents. The average rate of change is less for Gas Station B
Comparing the Average Rates of Change of Two Functions John and Mike opened savings accounts on the same day. They did not deposit any money initially, but deposited each week as shown by the graph and the table. Compare the average rates of change and explain what the rates represent in this situation.
Comparing the Average Rates of Change of Two Functions John and Mike opened savings accounts on the same day. They did not deposit any money initially, but deposited each week as shown by the graph and the table. Compare the average rates of change and explain what the rates represent in this situation. Mike saves about 43 cents more per week.
Comparing Exponential and Polynomial Functions. Compare the end behavior of the functions f(x) = – x2 and g(x) = 4 log x.
Comparing Exponential and Polynomial Functions. Compare the end behavior of the functions f(x) = 4x2 and g(x) = x3.