Download

1 / 28
280 likes | 385 Views
PROFIT by Design. By Philip Croessmann, AIA, Esq. Steven L. Biegel, AIA, LEED AP. PROFIT by Design. Elements of A/E firm Profitability. Equity Professional liability Successful management Professional skill & judgment Entrepreneurial risk Extra time Innovation.

E N D
PROFITbyDesign By Philip Croessmann, AIA, Esq. Steven L. Biegel, AIA, LEED AP
PROFITby Design Elements of A/E firm Profitability • Equity • Professional liability • Successful management • Professional skill & judgment • Entrepreneurial risk • Extra time • Innovation
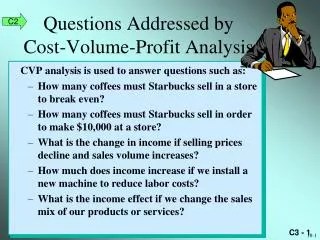
PROFITby Design Terminology • Reserves • Backlog • Collections • Utilization • Business Plan • Front Side/Back Side • Contribution • Bookings/Sales • Revenue Recognition • EBIDTA • Earned Revenue • Cash Flow • Billings • Overhead • Allowable Costs • Direct Costs • InDirect Costs • Accounts Receivable • DSOs (Days Sales Outstanding) • WIP (Work-In-Progress)
PROFITby Design Firm Profitability (Pre-Tax) 6.05% 12.72% 14.49% 19.21% 22.19% • All As & Es • Top 25% of As & Es • Top 25% of As Only • Top 10% of Es Only • Top 10% of As Only Source: PSMJ Financial Statistics Survey
PROFITby Design Gross Revenue = Total fees earned and recognized through performance of services for a customer. Net Revenue = Gross revenue minus expenses for supplies, consultants and external services.
PROFITby Design Gross Profit = Total revenue earned and recognized above all direct and indirect expenses (including consultant services). Net Profit = Gross profit minus costs for interest, taxes, depreciation, amortization, reinvestment, staff retention (bonuses).
PROFITby Design Revenue Recognition = Fees earned at the time when sales are consummated or services provided that create an obligation on the part of the customer to make payment for the sales or services.
PROFITby Design Practice Sectors/Regulations • Private Sector • Institutional Sector • Federal Sector Unregulated Somewhat Regulated Highly Regulated Risk/Reward High Risk/High Reward Modest Risk/Modest Reward Low Risk/Low Reward • Private Sector • Institutional Sector • Federal Sector
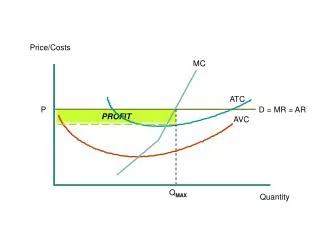
PROFITby Design Cost/Volume/Profit PRE-TAX PROFIT PROFIT GROSS INCOME LOSS INDIRECT COSTS BREAK EVEN CONTRIBUTION RATE * GROSS INCOME-TOTAL DIRECT COSTS GROSS INCOME * CONTRIBUTION RATE =
PROFITby Design RANGE OF PRIVATE PROFITABILITY RANGE OF FEDERAL PROFITABILITY TARGET PROFIT PROFIT 0 BREAK EVEN INDIRECT COSTS PRIVATE CONTRIBUTION @ 60% TARGET PROFITPRIVATE SECTOR TARGET PROFITFEDERAL SECTOR BREAKEVEN VOLUME. REVENUE TO ACHIEVE REVENUE TO ACHIEVE FEDERAL SECTOR BREAKEVEN VOLUME. PRIVATE WORK FEDERAL CONTRIBUTION @ 50% GROSS REVENUE Inter-Relationships (Private vs. Federal)
PROFITby Design Typical Project Costs PROFIT CONTRIBUTION INDIRECT COSTS TOTAL PROJECT COMPENSATION DIRECT COSTS
PROFITby Design Factors Impacting Contribution and Profit Case A:Inadequate O.H. Allowance Negotiated Actual Correct/Realistic
PROFITby Design Factors Impacting Contribution and Profit Case B:Inadequate Project Profit Allowance Negotiated Actual Correct/Realistic
PROFITby Design Factors Impacting Contribution and Profit Case C:ExcessiveDirectCosts Negotiated Actual Correct/Realistic
PROFITby Design Factors Impacting Contribution and Profit Case D:Combination of A + B + C Negotiated Actual Correct/Realistic
PROFITby Design Utilization = Ratio expressing efficiency of labor devoted to earning revenue. Usually expressed as total direct project hours divided by total of all person hours “paid for” within a specific time period. For example: 10 Employees @ 40/hrs/wk = (400 hrs) Total Direct Project Hours = 297 (Time Sheets) Utilization = 297 400 = 74.25%
PROFITby Design Work-In-Progress (WIP) Month 1 Month 2 Month 3 Month 4 Month 5 BEGIN WORK CLIENT BEGINS PROCESSING BILL SEND BILL CALCULATE BILL 90 DAYS (AVERAGE) COLLECTMONEY FLOAT (FIRM FRONTS ALL $) $10k/EMP.PER MONTH
PROFITby Design DSOs (Days Sales Outstanding) From the time hours are posted on the time sheet . . .The revenue has been earned and compensation is due. Client may not be aware of fees owed for 30-45 days. Client may take 90-120 days to pay! Typical DSO calculation: Average Days of Project WIP = 15 days Actual Days to Collect after Bill = 63 days Total DSO = 78 days
Phase 8 Phase 1 Phase 2 Phase 3 Phase 4 Phase 5 Phase 6 Phase 7 Construction Contract Post Construction PreDesign Site Analysis Schematic Design Design Development Construction Document Bidding or Negotiations Services Services Services Services Services Services Administration Services Services 1 2 3 4 5 6 7 8 Project Project Project Project Project Project Project Administration Administration Administration Administration Administration Administration Administration Disciplines Coor- Disciplines Coor- Disciplines Coor- Disciplines Coor- Disciplines Coor- Disciplines Coor- Disciplines Coor- dination / Docu- dination / Docu- dination / Docu- dination / Docu- dination / Docu- dination / Docu- dination / Docu- ment Checking ment Checking ment Checking ment Checking ment Checking ment Checking ment Checking Agency Consulting Agency Consulting Agency Consulting Agency Consulting Agency Consulting Agency Consulting Agency Consulting / Review / / Review / / Review / / Review / / Review / / Review / / Review / Approval Approval Approval Approval Approval Approval Approval Owner-supplied Owner-supplied Owner-supplied Owner-supplied Owner-supplied Owner-supplied Owner-supplied Data Coordination Data Coordination Data Coordination Data Coordination Data Coordination Data Coordination Data Coordination Programming Site Analysis and Architectural Architectural Architectural Building Materials Office Selection Design / Design / Design / Construction Documentation Documentation Documentation Administration Space Schematics Site Development Structural Design / Structural Design / Structural Design / Addenda Construction Field / Flow Diagrams Planning Documentation Documentation Documentation Observation Existing Facilities Detailed Site Mechanical Design Mechanical Design Mechanical Design Bidding / Project Surveys Utilization Studies / Documentation / Documentation / Documentation Negotiations Representation On-Site Utility Electrical Design / Analysis of Inspection Electrical Design / Electrical Design / Marketing Studies Alternates / Studies Documentation Coordination Documentation Documentation Substitutions Economic Off-Site Utility Civil Design / Civil Design / Civil Design / Supplemental Special Bidding Feasibility Studies Studies Documentation Documentation Documentation Documents Services Project Finance Environmental Landscape Design Landscape Design Landscape Design Quotation Bid Evaluation Studies and / Documentation / Documentation / Documentation Requests / Reports Change Orders Interior Design / Interior Design / Interior Design / Construction Project Schedule Zoning Processing Documentation Documentation Documentation Contract Monitoring Assistance Agreements Materials Materials Materials Construction Cost Research / Research / Research / Accounting Specification Specification Specification Project Project Project Project Project Project Closeout Development Development Development Development Development Scheduling Scheduling Scheduling Scheduling Scheduling Statement of Statement of Statement of Project Budgeting Project Budgeting Probable Con- Probable Con- Probable Con- struction Cost struction Cost struction Cost Presentations Presentations Presentations Presentations Presentations PROFITby Design Phase/Service Matrix
PROFITby Design Design Construction Bidding & Construction Schematic Design Development Documents Negotiating Services TRADITIONAL APPROACH STREAMLINED INTEGRATED APPROACH
PROFITby Design Once Through Process Pre Design Programming SD DD CD BID Construction • Keep schematic Iterations to a minimum • Never repeat a phase without additional $ • Strive for quick design decisions
PROFITby Design Firm Structure • Flat management structure is not necessarily good • Keep Overhead Low VERTICAL HORIZONTAL
PROFITby Design Typical Firm Growth PRESSURE TO CONTROL OVERHEAD & DISALLOWABLE COSTS COMPETITIVE FEE OVERLAY PERSONNEL COSTS ($) YEAR 5 YEAR 10 YEAR 20 TIME (LIFE OF FIRM)
PROFITby Design Goals to Assure Profit • Selective about type of work/client • Negotiate best possible fee • Keep scope limited/well defined • Utilization must be high • Overhead must be low/controlled • Good, clear contracts • Recognize revenue immediately • Strive for “once through process” • No mistakes • Keep DSOs Down (Collect $)
PROFITby Design Business Plan • Financial Goals (Annual) • Marketing Goals • Staff Development Goals • Design/Recognition Goals Plan should clearly describe yearly goals and contain concise narrative stating “How” these goals will be achieved.
PROFITby Design “Commodity Business” • Architects market professional services • Architects sell professional time • Architecture is a commodity business with staff hours as the commodity
PROFITby Design “Profit by Design” • We are in business to make money • We make money by working efficiently • Demand for our services is driven by both quality and cost . . . (mostly cost). • We grow a business (including reputation) in order to one day sell that business.