Download
1 / 73
740 likes | 767 Views
INTERPRETATION OF DOPPLER WEATHER RADAR ECHOES. Wing Commander VS Srinivas Directing Staff, AFAC Indian Air Force. INTERPRETATION OF DOPPLER WEATHER RADAR ECHOES. 1. The Doppler Weather Radar emits beams (pulses) of Microwave energy from a transmitter into the atmosphere.

E N D
INTERPRETATION OF DOPPLER WEATHER RADAR ECHOES Wing Commander VS Srinivas Directing Staff, AFAC Indian Air Force
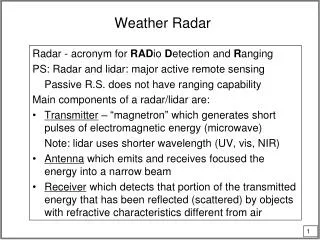
INTERPRETATION OF DOPPLER WEATHER RADAR ECHOES 1. The Doppler Weather Radar emits beams (pulses) of Microwave energy from a transmitter into the atmosphere. 2. When these beams collide with objects in the atmosphere, such as raindrops, hail stones, snowflakes, cloud droplets, birds, insects, dust particles, trees, and even the ground, some of the energy bounces back towards the radar. 3. A receiver on the radar collects the reflected energy and displays (EM Spectrum as Fig. 1)
INTERPRETATION OF DOPPLER WEATHER RADAR ECHOES Fig. 1 : EM Spectrum
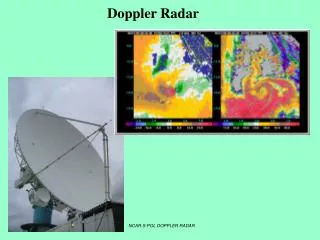
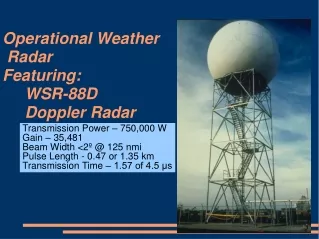
INTERPRETATION OF DOPPLER WEATHER RADAR ECHOES 4. Doppler radar came into use when the Weather Surveillance Radar – 1988 Doppler radar (WSR-88D), was installed in place of the Weather Surveillance Radar – 1974 (WSR-74). 5. Currently, there are 158 such WSR-88D radars that operate around the USA. These are part of a network of Doppler Radars, called as Next Generation Radar (NEXRAD). 6. Individual radar sits inside a dome that rests on a tower about 100 feet tall. The transmitter on the radar emits beams of microwave energy in all horizontal directions to send energy to every part of the lower atmosphere. Fig. 2 shows the display.
INTERPRETATION OF DOPPLER WEATHER RADAR ECHOES Fig. 2 : Radar Display
INTERPRETATION OF DOPPLER WEATHER RADAR ECHOES • 7. Since radars have a certain spatial resolution, the radar patterns look gridded when zoomed. • 8. Many radar programs use smoothing algorithms which smooth data and make it look more natural. • 9. However, the interpretation of the radar image is always using their true form which has not been smoothed. Each individual block, box, or square of data you see on radar is called a pixel, bin, or gate. As you move outward along a straight line, the bins that form on a connected line is radial.
INTERPRETATION OF DOPPLER WEATHER RADAR ECHOES 10.The range or distance from the radar site and azimuth or angle made between the radial that points to true north and the radial that points to the bin of interest are used to determine location on radar. 11. The radar data is represented by a bin on a colour scale. This coloured bin is called an echo or return (As shown in Fig. 3). 12. All radars have a transmitter, a receiver, and an antenna. The transmitter emits pulses of microwave energy. The receiver receives reflected energy.
INTERPRETATION OF DOPPLER WEATHER RADAR ECHOES Fig. 3: Pixels / Bins / Gates and Radials in Radar Display
INTERPRETATION OF DOPPLER WEATHER RADAR ECHOES CHARACTERISTICS OF DOPPLER RADAR 13. All Doppler radars rotate horizontally as they transmit energy. They can also tilt vertically. 14. A radar scans horizontally 360° at anywhere from four to fourteen different vertical angles. 15. The standard elevation angle is 0.5° above the horizontal, which is the base angle (base X is one of many products, such as reflectivity or velocity). 16. When radar finishes scanning in 360° at one elevation angle, it tilts up to the next elevation angle and scans 360° at that angle, too.
INTERPRETATION OF DOPPLER WEATHER RADAR ECHOES 17. While radar transmits energy, it cannot detect reflected energy. It is possible to determine how long the radar is transmitting a pulse by measuring the radius of that circle. 18. The larger the circle, the longer the radar is transmitting. Since radar alternates between transmitting and receiving energy, a term called the Pulse Repetition Frequency (PRF) is defined as the rate at which the radar sends pulses. 19. Microwave energy emitted by radar is a wave and has all the characteristics of waves like wavelength (distance between successive peaks or valleys).
INTERPRETATION OF DOPPLER WEATHER RADAR ECHOES 20. In the Microwave portion of the electromagnetic spectrum, wavelengths vary between 1 mm to 1 m. 21. In a Doppler radar different wavelengths are used. S-band uses 10 cm, C-band uses 5 cm and X-band uses 2 cm wavelengths. The Wavelength used is related to:- (a) The size of particles the radar can detect. (b) The beam attenuation after it bounces off reflectors. (c) Value of velocity that can be measured.
INTERPRETATION OF DOPPLER WEATHER RADAR ECHOES 22. The shorter the wavelength, the smaller the particles the radar can detect. Attenuation means weakening of the beam due to energy being deflected away or absorbed by particles as the beam travels away from the radar. 23. When a radar beam travels through several intense thunderstorms the beam encounters very large number of raindrops. 24. The more raindrops the beam bounces off of, the less energy is left to travel farther to more distant storms.
INTERPRETATION OF DOPPLER WEATHER RADAR ECHOES 25. The product base reflectivity displays the amount of energy returned to the radar. 26. This makes it appear thunderstorms that are farther have less intensity where as they may be as intense as or more intense than the storms closer to the radar. 27. Radars have a certain resolution of data (by radial and azimuth).
INTERPRETATION OF DOPPLER WEATHER RADAR ECHOES • BEAM SPREADING 28. The radial resolution of radar is the number of bins for a given distance that beam travels. In latest radars one bin for every 250 meters gets covered. 29. The azimuthalresolution (also called beam width or beam separation) of radar is the number of radials that the radar can depict in terms of degrees of a circle. 30. For example, if there are 360 radials that can be shown by radar, then that radar has one radial for every degree in azimuth. Therefore, the azimuthal resolution for that radar is 1°.
INTERPRETATION OF DOPPLER WEATHER RADAR ECHOES Fig. 4 : Concept of Beam Spreading – outer-most circle corresponds to effective radar range
INTERPRETATION OF DOPPLER WEATHER RADAR ECHOES 31. Beam spreading is a term that describes the change in the size of a bin as distance from the radar site increases due to the spreading of radar beams at adjacent radials as they move away from the radar site. In the figure the outer bin is larger than the inner bin. 32. Thus, it is clear that since a single bin only represents one point of data, then the radar data is at a seemingly lower resolution farther from the radar than it is closer to the radar. 33. This causes differences in appearance of radar returns far from and close to the radar site. The same can be clearly seen in the following Radar echo (As shown in Fig. 5).
INTERPRETATION OF DOPPLER WEATHER RADAR ECHOES Fig. 5 : Storms very close to the radar (near the centre of the image) appear much finer and less blocky than the storms far from the radar
INTERPRETATION OF DOPPLER WEATHER RADAR ECHOES • 34. Base reflectivity is a radar product that displays the amount of power reflected off particles to the radar. • 35. The actual amount of energy returned is displayed in terms of reflectivity and is measured in decibels (dBZ). • 36. A decibel is a measure of the energy transmitted by a wave, or a measure of the amplitude of a wave (As shown in Fig. 6). BASE REFLECTIVITY
INTERPRETATION OF DOPPLER WEATHER RADAR ECHOES Fig. 6 : Reflectivity Image - strength of returns to the radar, measured in decibels (dBZ)
INTERPRETATION OF DOPPLER WEATHER RADAR ECHOES • 37. The usual range of reflectivity that is displayed by this product is between 0 dBZ and 80 dBZ, with 0 dBZ indicating very little return of energy and 80 dBZ indicating extremely intense returned energy, a value never reached in meteorological scenarios. • 38. The value of reflectivity in a bin of data is actually the average of all the reflectivity values detected within that bin (there will be multiple targets that reflect the energy within the areal space of one bin. All do not reflect the same amount of energy).
INTERPRETATION OF DOPPLER WEATHER RADAR ECHOES • 39. Also it is useful to understand reflectivity gradient or change of reflectivity over a distance of a few bins. • 40. This is important at large distances from the radar site. Base reflectivity shows echoes whenever energy from the radar beam bounces back to it. • 41. Anything in the atmosphere that can reflect microwave energy will cause echoes to appear on a radar display. Many times, these echoes are not precipitation, but are meteorological in nature. If base reflectivity shows echoes that are not meteorological in nature, the echoes are called anomalous propagation.
INTERPRETATION OF DOPPLER WEATHER RADAR ECHOES 42. A boundary between warm moist air and cool dry air causes reflection of a wave. This boundary will be seen as a very narrow line of light reflectivity. This boundary can be a warm or cold front, a dry line, or outflow boundary from thunderstorms.
INTERPRETATION OF DOPPLER WEATHER RADAR ECHOES (a) When the radar is in precipitation mode, the range of dBZ values displayed can be as low as 5 to a maximum of 75, whereas clear air mode offers a range from -28 to +28. The reason negative dBZ values can occur in clear air mode is because the dBZ is a logarithmic. (b) So an increase of 3 dBZ actually represents a doubling of power returned. Anytime Z is less than 1 mm6/m3, dBZ becomes negative. Negative dBZs are only found when the radar is in clear air mode. (c) Given that light snow is falling, the radar operator needs the radar in its most sensitive mode, namely, clear air mode. Notice the negative dBZ values in the dark taupe color. If the radar were in precipitation mode, the amount of coverage would be limited to the blue areas.
INTERPRETATION OF DOPPLER WEATHER RADAR ECHOES (d) A negative dBZ means that the radar is detecting very small hydrometeors. As mentioned above, this is great way for forecasters to detect very dry light snow or drizzle which have lower reflectivities. It may also be useful to detect outflow boundaries and drylines.
INTERPRETATION OF DOPPLER WEATHER RADAR ECHOES THREE-BODY SCATTER SPIKE (TBSS) 43. A TBSS is an anomalous echo caused by very large hail in a storm. When the radar beam moves through a storm containing large hail, the beam may deflect off the large hail and move towards the ground. 44. After hitting the ground, the energy reflects back up to the hail, and back to the radar. In this phenomenon a noticeable time delay between the energy reflected from the contact of the beam and hail and the energy reflected from the ground after collision.
INTERPRETATION OF DOPPLER WEATHER RADAR ECHOES Fig. 7 : Three-Body Scatter Spike (Red Oval – atmospheric region containing Rain and Hail; Blue arrows - path of radar beam)[Three Body Scatter Spike is named due to the three reflections of the radar beam that occur to give this reflectivity pattern]
INTERPRETATION OF DOPPLER WEATHER RADAR ECHOES 45. The radar will interpret this delay as echoes farther from the radar site. Therefore a TBSS will appear on radar as a spike or long, narrow extension of light reflectivity on the backside of the storm (As shown in Fig. 7). 46. This spike occurs along a radial. A TBSS is not seen across radials. An example of radar echo with TBSS can be seen in Fig. 8.
INTERPRETATION OF DOPPLER WEATHER RADAR ECHOES Fig. 8 : TBSS as streak of low reflectivity, extending past the storm along five radials (White bins in the storm - Reflectivity values of over 70 dBZ, a strong indication of large hail in the storm). TBSS is an even stronger indicator of presence of large hail
INTERPRETATION OF DOPPLER WEATHER RADAR ECHOES BRIGHT BANDING 47. Bright Banding is a region of relatively intense reflectivity. This is found along a boundary between frozen and liquid precipitation. 48. The high reflectivity is not an indication of heavy precipitation but is an indication of liquid coating on frozen precipitation. 49. Liquid water reflects microwave energy better than frozen water. At the boundary between frozen and liquid precipitation, there will be a mix of both phases of water.
INTERPRETATION OF DOPPLER WEATHER RADAR ECHOES 50. The liquid coating on the frozen particles will make the particles appear much larger to the radar due to reflecting much more energy. An observer can interpret frozen and liquid precipitation. 51. Frozen precipitation will appear smooth and is associated with small reflectivity gradients. However the overall reflectivity is lower than liquid precipitation (As shown in Fig. 9).
INTERPRETATION OF DOPPLER WEATHER RADAR ECHOES Fig. 9 : Bright Banding is occurring just to NE of radar site, indicated by orange and red colour; Frozen precipitation to NW of bright banding appears smoother compared to liquid precipitation to SE; High Reflectivity is due to Bright Banding (Reflectivity is depicted after smoothing)
INTERPRETATION OF DOPPLER WEATHER RADAR ECHOES • 52. The same principle is used to explain why Hail is associated with high values of reflectivity on radar. Reflectivity values above 60 dBZ are indications that hail, or a mixture of heavy rain and hail is being present (As shown in Fig. 10).
INTERPRETATION OF DOPPLER WEATHER RADAR ECHOES Fig. 10 : High Reflectivity with values > 60 dBZ in pink are indicators of hail, or a mixture of very heavy rain and hail; liquid coating on hailstones causes them to reflect more of energy back to radar
INTERPRETATION OF DOPPLER WEATHER RADAR ECHOES • 53. Base Velocity is a radar product that displays the average wind speed (and the direction) of particles that are detected by the radar. • 54. The radar measures the speed based on the Doppler Effect, in which the frequency of a wave changes as it bounces off a particle that is moving (e.g., the particle in the atmosphere) with respect to an object that is not moving (i.e., the radar). • 55. Since radar sends pulses of energy in one direction per pulse, the wind speed detected is necessarily a speed in the direction of the beam. BASE VELOCITY
INTERPRETATION OF DOPPLER WEATHER RADAR ECHOES • 56. An individual Doppler radar cannot measure or calculate wind in more than one dimension. However, two Doppler radars that are not in the same location can. It is important to note that when you are looking at a display of base velocity, you are looking at the wind speed either directly towards or directly away from the radar. • 57. Since there are more than 360 different angles along which you can approach radar, the wind velocity detected at one location may not be the same wind velocity detected at a different location, even if the product indicates the same magnitude of wind at both locations.
INTERPRETATION OF DOPPLER WEATHER RADAR ECHOES 58. Positive values of velocity mean that there is a positive correlation between distance and direction (i.e., if you’re moving away from the radar site, the wind is in the same direction as the one in which you are travelling). 59. This means the wind direction is away from the radar when values are positive and towards the radar when values are negative. 60. This is commonly marked with a green colour for velocities towards the radar and red for velocities away from the radar (Fig. 11).
INTERPRETATION OF DOPPLER WEATHER RADAR ECHOES Fig. 11 : Green colour to SW of radar, along with Red colour to NE, indicate that winds are flowing towards NE
INTERPRETATION OF DOPPLER WEATHER RADAR ECHOES 61. Usually, the most interesting areas are those where red and green colours meet, especially if the values are large where they meet. 62. Base Velocity is a very useful radar product. Associated with base velocity is the estimation of wind shear. Wind shear is a change of velocity with height. A change in wind speed or direction as you ascend is wind shear [As shown in Fig. 12(a) & (b)].
INTERPRETATION OF DOPPLER WEATHER RADAR ECHOES Fig. 12 : Base Velocity image shows :- (a) clockwise turning of winds with height indicated by curving of zero isodop, as one moves away from radar site. (b) as a 4.5° elevation scan shows clearly wind Shear appearing
INTERPRETATION OF DOPPLER WEATHER RADAR ECHOES 63. Approach of a front towards the radar can be determined based on the change of wind across the front from the echoes. Consider the example of a Frontal Passage based on Base Velocity, as shown in Fig. 13.
INTERPRETATION OF DOPPLER WEATHER RADAR ECHOES Fig. 13 : Base Velocity image with different colour scale. Zero isodop running nearly due W to E indicates winds from S to N to east of radar site and from N to S to west of the radar site, with a boundary (SSW-NNE oriented and passes almost directly through the radar) across which wind directions drastically change. It is a Cold Front!
INTERPRETATION OF DOPPLER WEATHER RADAR ECHOES 64. Based on the Base Velocity in thunderstorms, the amount of rotation present can be determined. Look for areas where red and green meet along adjacent radials (As shown in Fig. 14). 65. If the green is to the left of the red (as you move away from the radar along a radial), the rotation is counter clockwise, or cyclonic. This also applies to clockwise rotation, if the colours are switched.
INTERPRETATION OF DOPPLER WEATHER RADAR ECHOES Fig. 14 : Rotation on Base Velocity. Large values of velocity are observed to SW of the reference city, where bright red and green colours meet. Winds in the area are rotating counter clockwise, and rapidly, due to the brightness of colours, indicating large velocity values (there are two adjacent bins with velocities between 70 & 100 kt).This rotation is depicting a Meso-cyclone, which has a large rotating region of air in the updraft area of a thunderstorm (a tornado is likely or imminent)
INTERPRETATION OF DOPPLER WEATHER RADAR ECHOES • 66. If red and green meet along the same radial (as you go outward), this represents convergence or divergence flowing together or flowing apart respectively.
INTERPRETATION OF DOPPLER WEATHER RADAR ECHOES PURPLE HAZE AND DOPPLER DILEMMA 67. Range Folding. Radar can only detect and synthesize data when the reflected energy from one pulse returns to the radar before the next pulse leaves. 68. If the reflected energy from one pulse does not make it back before the next pulse is emitted, the radar becomes confused and usually throws the data out or marks it as bad data. 69. The reason reflected energy may not make it back in time is because it travelled too far from the radar (Fig. 15). This is known as Doppler Dilemma.
INTERPRETATION OF DOPPLER WEATHER RADAR ECHOES Fig. 15 : Base Velocity image shows Purple Haze towards outer edges of radar range. PRF of radar was such that pulses travelling into purple regiondid notmake it back before the next pulse wasemitted. All of the coloured purple echoes are range folded
INTERPRETATION OF DOPPLER WEATHER RADAR ECHOES Fig. 16 : Radar scans in 360° horizontally at multiple elevations [Lines represent planes through which the radar scans according to different elevation angles; Cone of silence is denoted as region above the highest elevation]
INTERPRETATION OF DOPPLER WEATHER RADAR ECHOES ANOMALOUS PROPAGATION (AP) 70. Anomalous Propagation is a term used to describe any radar returns that does not represent precipitation or other meteorological objects 71. These anomalous echoes result from certain atmospheric properties and man-made objects. 72. The two types of anomalous propagation are ground clutter and super refraction. 73. Ground clutter objects will not move with time and sometimes appear very intense on base reflectivity ( As shown in Fig. 17).
INTERPRETATION OF DOPPLER WEATHER RADAR ECHOES Fig. 17 : Ground Clutter is shown as random scattered Low Reflectivity, very close to radar site. No precipitation is falling, where this reflectivity is occurring.