Download
1 / 27
270 likes | 538 Views
Types of Corn Co-Products. Corn gluten feed: wet millCorn bran steepCan be wet or dryModerate crude protein, CP = 16-23

E N D
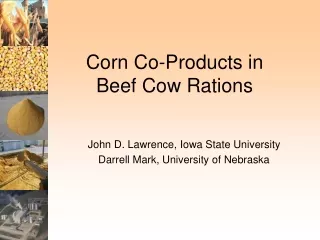
1. Corn Ethanol Co-Products For Finishing Beef Cattle Darrell R. Mark, University of Nebraska�Lincoln
Galen Erickson, University of Nebraska�Lincoln
Crystal Buckner, University of Nebraska�Lincoln
2. Types of Corn Co-Products Corn gluten feed: wet mill
Corn bran + steep
Can be wet or dry
Moderate crude protein, CP = 16-23%
80% of CP is DIP (ruminally degradable)
Low fat, moderate fiber, TDN = 80
101-115% of energy value of dry-rolled corn
Product variation is significant within and across plants due to amount of steep added back to the corn bran Corn gluten feed is produced from a wet milling process in which relatively high quality corn (#2 or better) is �steeped� and the kernel components are separarted into corn bran, starch, corn gluten meal (protein), germ, and soluble components. Wet corn gluten feed (WCGF) is corn bran plus steep liquor, and possibly germ meal depending upon the plant). Steep liquor contains more energy and protein than corn bran or germ meal, so the more steep added, the higher protein and energy in the WCGF. If WCGF is dried to form dry corn gluten feed (DCGF), the energy value is less than WCGF when fed at high levels in finishing diets.
WCGF is different than corn gluten meal. Gluten meal is high in protein (about 60%), but about 60% of it is bypass protein (undegradable intake protein). WCGF is 16-23% crude protein, but only about 20% of that is undegradable intake protein (80% is ruminally degradable intake protein, DIP).
This product is often marketed under a brand name by the company. For example, Sweet Brand (Cargill).Corn gluten feed is produced from a wet milling process in which relatively high quality corn (#2 or better) is �steeped� and the kernel components are separarted into corn bran, starch, corn gluten meal (protein), germ, and soluble components. Wet corn gluten feed (WCGF) is corn bran plus steep liquor, and possibly germ meal depending upon the plant). Steep liquor contains more energy and protein than corn bran or germ meal, so the more steep added, the higher protein and energy in the WCGF. If WCGF is dried to form dry corn gluten feed (DCGF), the energy value is less than WCGF when fed at high levels in finishing diets.
WCGF is different than corn gluten meal. Gluten meal is high in protein (about 60%), but about 60% of it is bypass protein (undegradable intake protein). WCGF is 16-23% crude protein, but only about 20% of that is undegradable intake protein (80% is ruminally degradable intake protein, DIP).
This product is often marketed under a brand name by the company. For example, Sweet Brand (Cargill).
3. Types of Corn Co-Products Distillers Grains + Solubles: dry mill
Distillers Grains (65%) & Solubles (35%) (DM basis)
May be wet or dried
Higher crude protein, CP = 30%
65% UIP (undegraded, �bypass�, protein)
High fat (11%), TDN = 70-110
Concentrates nutrients 3-fold from corn
0.8% P, 0.35-1.0% Sulfur (variable) Distillers Grains plus Solubles are produced from a dry mill process where corn is ground, fermented, and the starch is converted to ethanol and carbon dioxide. About one-third of the dry matter remains as the feed product following fermentation of the starch. This means that nutrients (like phosphorous and sulfur become concentrated at levels 3 times that of corn.
Newer plants are more efficient and may produce up to 3 gallons per bushel of corn, but the amount of DDGS is still about 17-18 pounds. Sulfur can be a problem when inclusion rates are relatively high. The main mycotoxin concern is aflotoxin and vomitoxin.
Distillers Grains plus Solubles are produced from a dry mill process where corn is ground, fermented, and the starch is converted to ethanol and carbon dioxide. About one-third of the dry matter remains as the feed product following fermentation of the starch. This means that nutrients (like phosphorous and sulfur become concentrated at levels 3 times that of corn.
Newer plants are more efficient and may produce up to 3 gallons per bushel of corn, but the amount of DDGS is still about 17-18 pounds. Sulfur can be a problem when inclusion rates are relatively high. The main mycotoxin concern is aflotoxin and vomitoxin.
4. Types of Corn Co-Products Condensed distillers soluables: dry mill
Also known as �syrup�
35% dry matter but in liquid form
Higher crude protein, CP = 26%
High fat, low fiber, TDN = 110-115
Modified DGS are available
(35-65% DM)
Hybrid wet & dry plant combining corn bran and distillers solubles ? bran cake
Example: Dakota Bran Cake The condensed solubles are often added to distillers grains to form DGS, but they can be sold separately. They are liquid and handled with a pump and stored in tanks. Can be mixed with low quality forage or fed free choice. Modified DGS are essentially dried distillers grains with the condensed solubles mixed back in. The dry matter is between WDGS and DDGS.
Other new combinations of coproducts are being developed and marketed. A hybrid wet and dry mill process, for example, is used to produce bran cake from corn bran and distillers solubles. It contains less protein than WDGS and WCGF and about the same neutral detergent fiber on a dry matter basis.The condensed solubles are often added to distillers grains to form DGS, but they can be sold separately. They are liquid and handled with a pump and stored in tanks. Can be mixed with low quality forage or fed free choice. Modified DGS are essentially dried distillers grains with the condensed solubles mixed back in. The dry matter is between WDGS and DDGS.
Other new combinations of coproducts are being developed and marketed. A hybrid wet and dry mill process, for example, is used to produce bran cake from corn bran and distillers solubles. It contains less protein than WDGS and WCGF and about the same neutral detergent fiber on a dry matter basis.
5. Nutrient Composition of Selected Corn Milling Co-Products The table contains data on plant averages and provides insight into the variation for the coproducts that exist from plant to plant and within a plant. The DDGS, WDGS, and CCDS are all from one plant in Nebraska during 2003.
Sampling frequency is important as actual variation observed from load to load at a feedyardis quite different than the variation from the weekly samples shown in the table.The table contains data on plant averages and provides insight into the variation for the coproducts that exist from plant to plant and within a plant. The DDGS, WDGS, and CCDS are all from one plant in Nebraska during 2003.
Sampling frequency is important as actual variation observed from load to load at a feedyardis quite different than the variation from the weekly samples shown in the table.
6. WDGS and WCGF tend to be high and energy and protein, and therefore can replace higher protein roughage sources like alfalfa in the ration. Higher quality (and higher priced) roughage like alfalfa can be replaced with cheaper roughage sources (like ground corn stalks, etc.).
Coproducts are highly palatable to cattle and keeps the cattle on feed. Once start feeding coproduct, though, you have to keep feeding it (need to have a relatively steady supply). You can�t feed it one week, then cut them off, then start again�
Acidosis generally isn�t a problem because the starch is removed during the milling process and the coproduct dilutes the remaining starch in the ration from the corn. Typically, corn is processed (ground, rolled, steam flaked, etc.) to increase rate of digestion by microbes, which increases rumen acid production and the risk of acidosis. Generally, dry rolled corn, fine ground corn, high moisture corn, and steam flaked corn have feed efficiency improvements over whole corn, for example. Benefits from feeding WCGF or WCDS across different corn processing methods isn�t yet clear, but it appears that higher coproduct inclusion levels do not improve performance for steam flaked corn relative to dry rolled or high moisture corn.
WDGS and WCGF tend to be high and energy and protein, and therefore can replace higher protein roughage sources like alfalfa in the ration. Higher quality (and higher priced) roughage like alfalfa can be replaced with cheaper roughage sources (like ground corn stalks, etc.).
Coproducts are highly palatable to cattle and keeps the cattle on feed. Once start feeding coproduct, though, you have to keep feeding it (need to have a relatively steady supply). You can�t feed it one week, then cut them off, then start again�
Acidosis generally isn�t a problem because the starch is removed during the milling process and the coproduct dilutes the remaining starch in the ration from the corn. Typically, corn is processed (ground, rolled, steam flaked, etc.) to increase rate of digestion by microbes, which increases rumen acid production and the risk of acidosis. Generally, dry rolled corn, fine ground corn, high moisture corn, and steam flaked corn have feed efficiency improvements over whole corn, for example. Benefits from feeding WCGF or WCDS across different corn processing methods isn�t yet clear, but it appears that higher coproduct inclusion levels do not improve performance for steam flaked corn relative to dry rolled or high moisture corn.
7. Energy Value of WDGS vs DDGS Fed at 40% of Diet DM In experiments with finishing cattle, the replacement of corn in the ration with wet distillers coproducts consistently improved feed efficiency.
Compare the second column in the table to the last three (which is DDGS with different levels of ADIN). The DDGS shows feeding improvements over the control diet (with no coproducts) and WDGS has average feeding improvements over DDGS.In experiments with finishing cattle, the replacement of corn in the ration with wet distillers coproducts consistently improved feed efficiency.
Compare the second column in the table to the last three (which is DDGS with different levels of ADIN). The DDGS shows feeding improvements over the control diet (with no coproducts) and WDGS has average feeding improvements over DDGS.
8. Energy Content of WDGS This figure summarizes several feeding studies involving wet distillers grains. The energy value (expressed as a percentage of corn) is consistently over 100% (fed up to 50% of the diet dry matter intake). The energy value at medium levels (12-28%) is about 140-150% of the energy of corn.
The experiments also indicate a 15-25% improvement in feed efficiency when 30-40% of the corn grain is replaced with WDG.This figure summarizes several feeding studies involving wet distillers grains. The energy value (expressed as a percentage of corn) is consistently over 100% (fed up to 50% of the diet dry matter intake). The energy value at medium levels (12-28%) is about 140-150% of the energy of corn.
The experiments also indicate a 15-25% improvement in feed efficiency when 30-40% of the corn grain is replaced with WDG.
9. Feed Efficiency & ADG Response To WDG Inclusion Rate This graph illustrates the feed efficiency (F:G) and average daily gain (ADG) response to including WDG at higher levels of the dietary intake (replacing corn grain) based on several feeding trials. F:G is best (lowest) and ADG the highest between 30-40% on a dry matter basis. Note that even at 50% inclusion rate, F:G and ADG is better than the control level (0%). This graph illustrates the feed efficiency (F:G) and average daily gain (ADG) response to including WDG at higher levels of the dietary intake (replacing corn grain) based on several feeding trials. F:G is best (lowest) and ADG the highest between 30-40% on a dry matter basis. Note that even at 50% inclusion rate, F:G and ADG is better than the control level (0%).
10. Feed Efficiency & ADG Response To DDG Inclusion Rate This graph illustrates the feed efficiency (F:G) and average daily gain (ADG) response to including DDG at higher levels of the dietary intake (replacing corn grain) based on several feeding trials. F:G is best (lowest) and ADG the highest between 20-30% on a dry matter basis. Note that even at 40% inclusion rate, F:G and ADG is better than the control level (0%).
This graph illustrates the feed efficiency (F:G) and average daily gain (ADG) response to including DDG at higher levels of the dietary intake (replacing corn grain) based on several feeding trials. F:G is best (lowest) and ADG the highest between 20-30% on a dry matter basis. Note that even at 40% inclusion rate, F:G and ADG is better than the control level (0%).
11. Economic Issues Associated With Feeding Ethanol Co-Products Performance improvements from feeding WDGS & WCGF at 30-40% dietary inclusion hedges against corn price increases
Cattle biological response to WDGS is quadratic and response to WCGF is linear
Feeding wet co-products leads to:
Increased trucking cost to feedyard
Increased feeding/handling cost within feedyard
Fewer days on feed (less yardage/interest cost) Unlike the DDGS and WDGS biological response illustrated on the previous two slides as a quadratic relationship, performance is linearly related to WCGF inclusion rate in the diet. The reason is because fat content isn�t a problem with WCGF (doesn�t degrade the performance response at higher inclusion levels).
If coproduct is priced at 95% of the corn price on a dry matter basis (as is typical), feeding more WDGS (at higher dietary DM intake) replaces more corn in the ration. This �substitutes� a slightly cheaper feedstuff into the ration. IF increased production of ethanol resulted in coproduct supply outpacing demand, this 95% fixed price relationship might become more variable, or lower.
Although feeding wet coproducts leads to better performance, additional expenses are incurred due to shipping and handling more water (less DM content for wet feeds).Unlike the DDGS and WDGS biological response illustrated on the previous two slides as a quadratic relationship, performance is linearly related to WCGF inclusion rate in the diet. The reason is because fat content isn�t a problem with WCGF (doesn�t degrade the performance response at higher inclusion levels).
If coproduct is priced at 95% of the corn price on a dry matter basis (as is typical), feeding more WDGS (at higher dietary DM intake) replaces more corn in the ration. This �substitutes� a slightly cheaper feedstuff into the ration. IF increased production of ethanol resulted in coproduct supply outpacing demand, this 95% fixed price relationship might become more variable, or lower.
Although feeding wet coproducts leads to better performance, additional expenses are incurred due to shipping and handling more water (less DM content for wet feeds).
12. Cattle Feeding Budget Model With WDGS & WCGF Inputs
Dietary ingredients (DM, inclusion, price)
Cattle performance (DMI, feed conversion)
Trucking distance, size, cost
Yardage, processing/health, interest rate Outputs
ADG & DOF
Total Costs
Yardage
Ration
Feeding expense
Co-product hauling
Net Return
Return to co-product feeding UNL cattle feeding budget program allows user to select from 5 different coproducts and input the coproduct and other input costs, the distance from the plant to transport the coproduct, and other dietary ingredients and feeding parameters to determine total costs and optimal inclusion rates for the coproducts.
What follows on slides 13 through 18 are examples from the program.
This model should be available in early 2007.UNL cattle feeding budget program allows user to select from 5 different coproducts and input the coproduct and other input costs, the distance from the plant to transport the coproduct, and other dietary ingredients and feeding parameters to determine total costs and optimal inclusion rates for the coproducts.
What follows on slides 13 through 18 are examples from the program.
This model should be available in early 2007.
13. Example Feeder cattle in-weight 740 lbs
Fed cattle out-weight 1300 lbs
Days on feed 153 days
DMI 24 lbs
Feed:Gain 6.5 lbs/lb
Yardage cost $0.35/hd/day
Trucking $3.00/loaded m
Corn price $2.76/bu
WDGS price 95% of corn price
(DM basis) Fairly typical yearling feeding scenario, evaluating use of WDGS.Fairly typical yearling feeding scenario, evaluating use of WDGS.
14. Marginal Return to WDGS Feeding with Varying Corn Prices Assuming a distance from the plant at 60 miles, the returns to feeding WDGS to 30% inclusion in the diet DM are just over $30/head. This increases substantially at higher corn prices (still assuming the WDGS is priced at 95% of the corn price on a DM basis). The numbers at the bottom left are the net profits (losses) to the feeding budget (on a per head basis) using the inputs on slide 13 assuming 0% WDGS inclusion in the diet. So, the returns on the y-axis are the improvements to this �bottom line� from feeding a particular level of WDGS.Assuming a distance from the plant at 60 miles, the returns to feeding WDGS to 30% inclusion in the diet DM are just over $30/head. This increases substantially at higher corn prices (still assuming the WDGS is priced at 95% of the corn price on a DM basis). The numbers at the bottom left are the net profits (losses) to the feeding budget (on a per head basis) using the inputs on slide 13 assuming 0% WDGS inclusion in the diet. So, the returns on the y-axis are the improvements to this �bottom line� from feeding a particular level of WDGS.
15. Marginal Return to WDGS Feeding with Varying Distances to Plant This time holding corn price constant at $3.50/bu, and varying the distance to the plant (transportation cost held at $3/mile) the returns to feeding WDGS are maximized at between 30 and 40% for a feedyard located AT the ethanol plant, but the optimal inclusion level drops to 20 to 30% for a feedyard 100 miles away from the plant. The number at the bottom left is the net profit (loss) to the feeding budget (on a per head basis) using the inputs on slide 13 assuming 0% WDGS inclusion in the diet. So, the returns on the y-axis are the improvements to this �bottom line� from feeding a particular level of WDGS.
Clearly, the closer a feedyard is to its coproduct source (ethanol plant), the more coproduct can be fed, and generate improved returns from doing so.This time holding corn price constant at $3.50/bu, and varying the distance to the plant (transportation cost held at $3/mile) the returns to feeding WDGS are maximized at between 30 and 40% for a feedyard located AT the ethanol plant, but the optimal inclusion level drops to 20 to 30% for a feedyard 100 miles away from the plant. The number at the bottom left is the net profit (loss) to the feeding budget (on a per head basis) using the inputs on slide 13 assuming 0% WDGS inclusion in the diet. So, the returns on the y-axis are the improvements to this �bottom line� from feeding a particular level of WDGS.
Clearly, the closer a feedyard is to its coproduct source (ethanol plant), the more coproduct can be fed, and generate improved returns from doing so.
16. Marginal Return to WDGS Feeding with Varying WDGS Prices Relative to Corn This time holding corn price constant at $3.50/bu and the distance to the plant at 60 miles, the returns to feeding WDGS are maximized at 30% when WDGS is priced at 95% of the corn price on a DM basis. This optimal inclusion level increases to about 40% as the WDGS drops to 75% of the corn price (on a DM basis). So, the cheaper the WDGS relative to corn, the more that can be included in the ration. The number at the bottom left is the net profit (loss) to the feeding budget (on a per head basis) using the inputs on slide 13 assuming 0% WDGS inclusion in the diet. So, the returns on the y-axis are the improvements to this �bottom line� from feeding a particular level of WDGS.
This time holding corn price constant at $3.50/bu and the distance to the plant at 60 miles, the returns to feeding WDGS are maximized at 30% when WDGS is priced at 95% of the corn price on a DM basis. This optimal inclusion level increases to about 40% as the WDGS drops to 75% of the corn price (on a DM basis). So, the cheaper the WDGS relative to corn, the more that can be included in the ration. The number at the bottom left is the net profit (loss) to the feeding budget (on a per head basis) using the inputs on slide 13 assuming 0% WDGS inclusion in the diet. So, the returns on the y-axis are the improvements to this �bottom line� from feeding a particular level of WDGS.
17. Marginal Return to WCGF Feeding with Varying Corn Prices Same scenario as on Slide 14, this time using WCGF instead of WDGS. Biological response to feeding WCGF is linear rather than quadratic, but problems exist for feeding at greater than 50% inclusion levels. Again, the higher price corn is assumed to be, the greater return to feeding coproduct at higher levels.Same scenario as on Slide 14, this time using WCGF instead of WDGS. Biological response to feeding WCGF is linear rather than quadratic, but problems exist for feeding at greater than 50% inclusion levels. Again, the higher price corn is assumed to be, the greater return to feeding coproduct at higher levels.
18. Budget Model Summary Model accounts for growth biology and changing prices
At 30% inclusion rate of WDGS, marginal return most impacted by corn price
Distance from plant and hauling cost not as important
Can evaluate the marginal benefit to multiple co-products
19. To Feed More Co-Product More ethanol production ? need to feed more co-products
More than 40% WDGS may add too much fat and sulfur to the diet
Possibility: Feed combinations of WDGS & WCGF
One current area of research is to find ways to feed more coproducts in general.
Typically, can�t feed more than about 40% WDGS due to sulfur (causes polio, or �brainers�). Also limited on feeding WCGF to high levels, although sulfur isn�t typically a problem. One possibility is to feed combinations of the two.One current area of research is to find ways to feed more coproducts in general.
Typically, can�t feed more than about 40% WDGS due to sulfur (causes polio, or �brainers�). Also limited on feeding WCGF to high levels, although sulfur isn�t typically a problem. One possibility is to feed combinations of the two.
20. WCGF & WDGS Combination Feeding Trial One feeding trial evaluated different combinations of WDGS & WCGF.
Here, the control diet contained 0% WDGS and 0% WCGF.
The first diet had 30% WCGF and 0% WDGS.
The second diet had 15% of each.
The third diet had 30% WDGS and no WCGF.
The fourth diet had 30% WDGS and 30% WCGF.One feeding trial evaluated different combinations of WDGS & WCGF.
Here, the control diet contained 0% WDGS and 0% WCGF.
The first diet had 30% WCGF and 0% WDGS.
The second diet had 15% of each.
The third diet had 30% WDGS and no WCGF.
The fourth diet had 30% WDGS and 30% WCGF.
21. WCGF & WDGS Combination Feeding Trial The ADG was max for the 30% WDGS (no combination) diet. This diet also had the lowest (best) feed conversion. The fourth diet (with 30% of each coproduct) had a lower ADG than for the other coproduct rations, but it was still better than the control diet.
It doesn�t appear (yet?) that the amount of coproduct fed to cattle can be increased substantially by feeding combinations of coproducts relative to the optimal levels of single coproducts. But, the fourth diet does �beat� the control diet, and uses the most coproduct. If the price of coproducts were to become cheaper than the price of corn (on a DM basis) due to increasing ethanol production, feeding combinations of coproducts may be the most economical.The ADG was max for the 30% WDGS (no combination) diet. This diet also had the lowest (best) feed conversion. The fourth diet (with 30% of each coproduct) had a lower ADG than for the other coproduct rations, but it was still better than the control diet.
It doesn�t appear (yet?) that the amount of coproduct fed to cattle can be increased substantially by feeding combinations of coproducts relative to the optimal levels of single coproducts. But, the fourth diet does �beat� the control diet, and uses the most coproduct. If the price of coproducts were to become cheaper than the price of corn (on a DM basis) due to increasing ethanol production, feeding combinations of coproducts may be the most economical.
22. Challenges DGS is most available in late summer
Seasonally cheapest then too
Seasonally fewest cattle on feed then too
Storing wet DGS product
Material exposed to air spoils in 7-14 days depending on temperature
Has low pH and does not ensile but will keep in air-tight storage for long periods
Spoilage loss stored in silage bags (Walker et al)
20% loss opened and fed day 78-112 post-sealing
28% loss opened and fed day 190-257 post sealing Research is ongoing to determine ways to store WDGS to take advantage of larger supplies (and typically lower prices) in the summer.
Research is ongoing to determine ways to store WDGS to take advantage of larger supplies (and typically lower prices) in the summer.
23. Seasonal Low in Cattle on Feed� Cattle on feed inventories are lowest in third quarter (August).Cattle on feed inventories are lowest in third quarter (August).
24. When WDGS Price Is Lowest Anecdotal information suggests that increased interest (and trying) to store may �smooth out� the seasonal price for coproducts in the next couple of years.Anecdotal information suggests that increased interest (and trying) to store may �smooth out� the seasonal price for coproducts in the next couple of years.
25. Storing WDGS Storing wet DGS product
Often delivered in truck load lots
Can store wet DGS in bunker, silage bag or in pile covered with plastic to protect from air
Can mix with tub-ground forage and stored in bunker or bag
Have to have the �mix� right�
26. Minimum Levels of Roughage To Mix in WDGS For Storage This shows minimum percentage levels of various roughages to mix into WDGS to �successfully� store it in either a silage bag or bunker silo.
NEWS RELEASE FROM IANR NEWS SERVICE, UNIVERSITY OF NEBRASKA
June 27, 2006
Mixing Dry Materials with Wet Ethanol Byproducts Increases Storage Life
LINCOLN, Neb. -- Wet byproducts from ethanol production are tricky to store for later use as cattle feed because of their high moisture content and threat of spoilage, but mixing them with drier, bulkier feeds improves storability, according to University of Nebraska-Lincoln research.
UNL animal scientists have just completed research that devised formulas for mixing several widely available dry forages with wet distillers grains. Their findings could help feedlot managers and cow-calf producers purchase wet distillers grains during the summer when their plentiful supply can mean lower prices and safely store them for use later in the season, or for winter feeding.
The relatively short shelf life of wet distillers grains has been a key obstacle to their use as feed in some situations, said Galen Erickson, a UNL beef nutritionist. Feedlots need to have the material delivered frequently and use it within a few days to avoid spoilage; for smaller operations, that's not economically feasible. Cow-calf operators, meantime, have greatest use for the feed during the winter, but that's when supplies tend to be lower than during the summer. At 65 percent moisture content, wet distillers grains alone cannot be stored in silage bags or bunkers like corn silage or bulkier feeds. Compressing them in bags to push out air and prevent spoilage splits the bags, and they're too wet to be compacted by tractors in bunkers.
UNL animal scientists experimented with mixing grass hay, alfalfa hay and wheat straw with the wet distillers grains to determine how much dry material would be needed for successful storage. For bagging, they compressed them at standard pressure, 300 pounds per square inch. "Other fiber sources would presumably work, but we chose these three because of their availability this time of year," said Erickson, who worked with Terry Klopfenstein, a UNL beef nutrition researcher on the project. When bagging silage, the Institute of Agriculture and Natural Resources researcher said, the research established the following minimal levels of dry material: 15 percent for grass hay; 22.5 percent, alfalfa hay; and 12.5 percent, wheat straw. Erickson noted that those percentages are on a dry basis, which is different than the amounts actually weighed out when mixing.
Researchers also experimented with mixing dry distillers grains and wet corn gluten feed, another ethanol byproduct, with the wet distillers grains. A 50-50 blend of dry and wet distillers grain bagged up well, while a 60-40 mixture of wet corn gluten and wet distillers grains seemed to work.
Erickson noted that two ethanol plants in Nebraska -- in Central City and Plainview --produce modified wet distillers grains, which has a moisture content of 50 to 55 percent. That material is dry enough to bag without mixing in other materials. For bunker storage, Erickson said, a mix of 40 percent grass hay and 60 percent wet distillers grains was firm enough to allow enough packing. With wheat straw, he recommends 25 to 32 percent of the dry material. There may be a 2-3 inch layer of spoilage at the top of the pile, but what's underneath seems to be fine.This shows minimum percentage levels of various roughages to mix into WDGS to �successfully� store it in either a silage bag or bunker silo.
NEWS RELEASE FROM IANR NEWS SERVICE, UNIVERSITY OF NEBRASKA
June 27, 2006
Mixing Dry Materials with Wet Ethanol Byproducts Increases Storage Life
LINCOLN, Neb. -- Wet byproducts from ethanol production are tricky to store for later use as cattle feed because of their high moisture content and threat of spoilage, but mixing them with drier, bulkier feeds improves storability, according to University of Nebraska-Lincoln research.
UNL animal scientists have just completed research that devised formulas for mixing several widely available dry forages with wet distillers grains. Their findings could help feedlot managers and cow-calf producers purchase wet distillers grains during the summer when their plentiful supply can mean lower prices and safely store them for use later in the season, or for winter feeding.
The relatively short shelf life of wet distillers grains has been a key obstacle to their use as feed in some situations, said Galen Erickson, a UNL beef nutritionist. Feedlots need to have the material delivered frequently and use it within a few days to avoid spoilage; for smaller operations, that's not economically feasible. Cow-calf operators, meantime, have greatest use for the feed during the winter, but that's when supplies tend to be lower than during the summer. At 65 percent moisture content, wet distillers grains alone cannot be stored in silage bags or bunkers like corn silage or bulkier feeds. Compressing them in bags to push out air and prevent spoilage splits the bags, and they're too wet to be compacted by tractors in bunkers.
UNL animal scientists experimented with mixing grass hay, alfalfa hay and wheat straw with the wet distillers grains to determine how much dry material would be needed for successful storage. For bagging, they compressed them at standard pressure, 300 pounds per square inch. "Other fiber sources would presumably work, but we chose these three because of their availability this time of year," said Erickson, who worked with Terry Klopfenstein, a UNL beef nutrition researcher on the project. When bagging silage, the Institute of Agriculture and Natural Resources researcher said, the research established the following minimal levels of dry material: 15 percent for grass hay; 22.5 percent, alfalfa hay; and 12.5 percent, wheat straw. Erickson noted that those percentages are on a dry basis, which is different than the amounts actually weighed out when mixing.
Researchers also experimented with mixing dry distillers grains and wet corn gluten feed, another ethanol byproduct, with the wet distillers grains. A 50-50 blend of dry and wet distillers grain bagged up well, while a 60-40 mixture of wet corn gluten and wet distillers grains seemed to work.
Erickson noted that two ethanol plants in Nebraska -- in Central City and Plainview --produce modified wet distillers grains, which has a moisture content of 50 to 55 percent. That material is dry enough to bag without mixing in other materials. For bunker storage, Erickson said, a mix of 40 percent grass hay and 60 percent wet distillers grains was firm enough to allow enough packing. With wheat straw, he recommends 25 to 32 percent of the dry material. There may be a 2-3 inch layer of spoilage at the top of the pile, but what's underneath seems to be fine.
27. Resources http://beef.unl.edu
www.iowabeefcenter.org
http://www.ddgs.umn.edu/