Download
1 / 19
200 likes | 496 Views
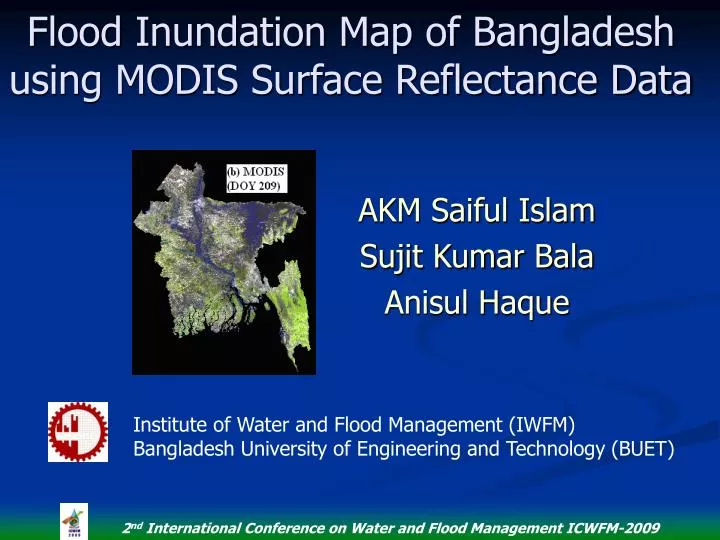
Flood Inundation Map of Bangladesh using MODIS Surface Reflectance Data. AKM Saiful Islam Sujit Kumar Bala Anisul Haque. Institute of Water and Flood Management (IWFM) Bangladesh University of Engineering and Technology (BUET). Introduction.

E N D
Flood Inundation Map of Bangladesh using MODIS Surface Reflectance Data AKM Saiful Islam Sujit Kumar Bala Anisul Haque Institute of Water and Flood Management (IWFM) Bangladesh University of Engineering and Technology (BUET)
Introduction • Flood is very common phenomenon in Bangladesh due to its geographic location. • Every year one third of Bangladesh has gone under floods. • Status of flood inundation in time and space is important in evaluating the relationships between variations in the water regime, local agricultural activity, and ecosystem behaviour from a global viewpoint.
Remote sensing images can be effective and efficient tools to determine flood inundation areas. • MODIS satellite with its moderate-resolution optical sensor of 250–500 m becomes useful tools for scientific studies and research. • Sakamoto et al. (2007) was developed a methodology to detect the spatio-temporal flood distribution in the Cambodia and Vietnam using MODIS data. • In this study this algorithm was modified to determine extent of flood inundation of Bangladesh.
Data Used • MODIS satellite data • TERRA sensor • SurfaceReflectance (band 1-8) • 8-Day temporal resolution • Product of Level 3 (atmospherically corrected) • Version 5 • Global coverage • 500 meter spatial resolution • Two major floods during 2004 and 2007
Landuse/Land Cover Classes • Single-crop rainfed rice in the Haor area of the north-eastern region • Single-crop irrigate rice in the south-western region • Double-cropped irrigated rice in the northern region • Triple-cropped irrigated rice in the Brand area of the north-western region • Forest area in the Sundarbans • settlement area of Dhaka city • Kaptai lake • Bay of Bengal ocean • the Padma river.
MODIS derived indices NDVI NDWI EVI LSWI
MODIS derived indices EVI LSWI DVEL =EVI-LSWI
Flood chart of Flood inundation map MODIS 8 day reflectance images MODIS derived indices: EVI, LSWI, DVEL ρBLUE ≥ 0.2 Cloud free indices: EVI, LSWI, DVEL DVEL ≤ 0.05 EVI ≤ 0.3 EVI ≤ 0.05 LSWI ≥ 0.0 EVI > 0.3 NO Non-Flood Water related pixel 0.1 < EVI EVI ≤ 0.3 total duration of water pixel > 120 days EVI ≤ 0.1 Mixture Flood Water bodies Flood Inundation Map
Long Term Water Bodies Inundation >120 days Long term Water bodies in 2007
Comparing MODIS with RADARSAT RADARSAT Inundation on 3rd August , 2007 Inundation map on 28th July, 2007 Using MODIS
Comparison with RADARSAT Image Comparing Pixels RADARSAT Vs MODIS
Maximum Extend of 2004 & 2007 Floods 2007 Flood 2004 Flood
Conclusion • This study modifies a methodology which was developed by Sakamoto et al. in order to detect spatial extents and temporal changes of flood inundation of Bangladesh during monsoon season. • MODIS satellite images were used develop flood inundation maps for floods in 2007 and 2004. • This low resolution (500m) MODIS based maps area compared with subsequent flood inundation maps based on high resolution (50m) RADARSAT satellite images. MODIS estimates show strong correlation with the inundation areas derived from RADARSAT with R2 values of 0.96. • MODIS images can be used successfully to determine start & end date, duration and maximum extent of flood.