Download
1 / 132
1.32k likes | 1.76k Views
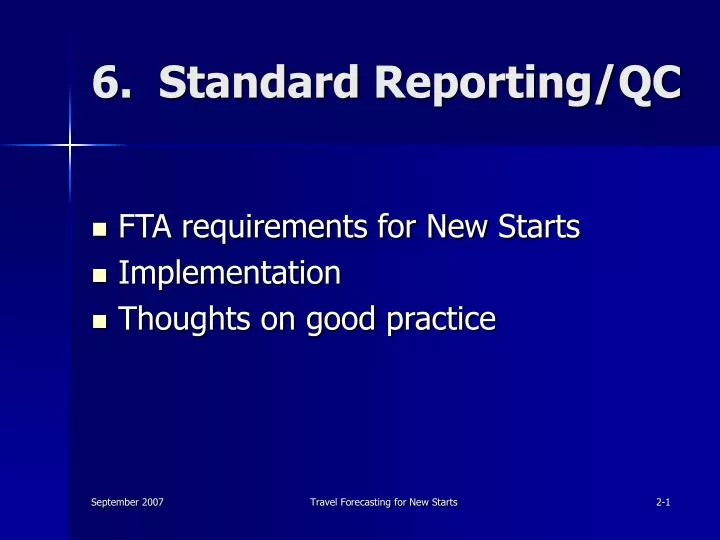
6. Standard Reporting/QC. FTA requirements for New Starts Implementation Thoughts on good practice. FTA Requirements. Standard Summit reports No-Build (2030) versus “today” TSM alternative versus No-build Build alternative versus TSM alternative Build opening year versus “today”

E N D
6. Standard Reporting/QC • FTA requirements for New Starts • Implementation • Thoughts on good practice Travel Forecasting for New Starts
FTA Requirements • Standard Summit reports • No-Build (2030) versus “today” • TSM alternative versus No-build • Build alternative versus TSM alternative • Build opening year versus “today” • QC reports • Tests on (1) project and (2) IVT • Template on “Travel Forecasts” • Transit assignment results * * * * = new in 2008 * Travel Forecasting for New Starts
Purpose • Enable routine quality control • Support a coherent story for the project • How is 2030 different from today? • What would TSM accomplish? • How much more would the project do? • What would the project do in its opening year? Travel Forecasting for New Starts
Changes over Time:Reports • No-Build versus Today • Build Opening Year versus Today 1.0 Demographics 2.0 Travel patterns 3.0 Travel times 4.0 Transit trips 5.0 Transit shares Travel Forecasting for New Starts
1.0 Demographics • General format • By district • Totals, absolute delta, relative delta • Contents 1.1 Population characteristics 1.2 Employment characteristics 1.3 Supporting statistics Travel Forecasting for New Starts
Supporting Statistics • Relationships between variables • Household size, workers per person, densities, parking costs, pop/emp ratio, etc. • Checks on trip generation • Δ population versus Δ trip productions • Δ employment versus Δ trip attractions Travel Forecasting for New Starts
2.0 Person Trips • General format • District-to-district • Totals, absolute delta, relative delta • Contents 2.1 Total person trips 2.2 Home-based work person trips 2.3 Other person trips (as needed) Travel Forecasting for New Starts
3.0 Travel Times • General format • District-to-district • Peak and off-peak • Averages, relative delta • Contents 3.1 Highway travel time 3.2 Transit in-vehicle time 3.3 Transit total weighted time Travel Forecasting for New Starts
Travel Time Calculations • Calculations • District-to-district aggregation of skims • Divided by district-to-district I-J cells • Impedances • Highway: drive-alone time • Transit: “best” walk access path • Transit cells: path available in both years Travel Forecasting for New Starts
4.0 Transit Trips • General format • District-to-district • Totals, absolute delta, relative delta • Contents 4.1 Total transit trips (all modes) 4.2 Home-based work transit trips 4.3 Other transit trips (as needed) 4.4 Guideway trips (by purpose, as needed) Travel Forecasting for New Starts
5.0 Transit Shares • General format • District-to-district • Totals, absolute delta, relative delta • Contents 5.1 Home-based work transit shares 5.2 Other transit shares (as needed) 5.3 Guideway shares (by purpose, as needed) Travel Forecasting for New Starts
Changes between Alternatives:Reports • TSM versus No-Build • Build versus TSM • Contents for each mode choice run 1.0 Transit trips 2.0 User benefits Travel Forecasting for New Starts
1.0 Transit Trips • General format • District-to-district • Totals, absolute delta, relative delta • Contents for each mode choice run 1.1 Transit trips 1.2 Transit trips by “transit dependents” 1.3 Guideway transit trips (as needed) Travel Forecasting for New Starts
2.0 User Benefits • General format • District-to-district • Contents for each mode choice run 2.1 Total user benefits 2.2 User benefits accruing to “transit dependents” Travel Forecasting for New Starts
2.0 User Benefits (cont.) 2.3 User benefits accruing to “base” riders • “Base” = TSM for 2030 Build versus TSM • “Base” = No-Build for 2030 TSM versus No-Build 2.4 “Base” riders’ share of user benefits 2.5 Negative user benefits 2.6 Negative user benefits as a share of total Travel Forecasting for New Starts
2.0 User Benefits (cont.) 2.7 Stratified tables • Build alternative transit trips by change in transit price, separately for CW-CW and MD-MD 2.8 Frequency distributions • Build transit trips by change in transit price • User benefits by change in transit price • All eight (8) access combinations 2.9 Thematic maps of user benefits by zone for (1) productions and (2) attractions Travel Forecasting for New Starts
Quality Control • Summit QC impacts in 2002 • Errors in models • Errors in service plans • Errors in transit network coding • Base|Build coverage inconsistencies • FTA analyses • User benefits unrelated to the project • User benefits other than transit IVT deltas routine case by case Travel Forecasting for New Starts
Quality Control Report 1 • Share of UBs directly related to project • Best paths by transit access (walk, drive) • UBs based on local models & best paths • I-J cells with path on the project (0/1) • UBs in I-J cells with project paths • Project UB share = step4 UBs / step2 UBs • Summit district-to-district reports • Project UB share < 80% ‘splaining Travel Forecasting for New Starts
Quality Control Report 2 • Share of UBs caused by Δ transit IVT • With best paths from Report 1: replace guideway-path IVT with IVT from baseline alternative • Rerun mode choice and Summit • IVT UB share = step2 UBs / best-path UBs • Summit district-to-district reports • ΔIVT share < 80% ‘splaining Travel Forecasting for New Starts
Example: Honolulu Fixed Guideway Travel Forecasting for New Starts
Travel Forecast TemplateInputs by Trip Purpose • Daily transit trips, base and build • Daily person trips (base = build) • Daily hours of user benefits (UBs) • Positive UB hours from coverage changes • MD-CW, NT-CW and NT-MD groups • Daily hours of UBs changed by capping • Daily hours of UBs for transit dependents Travel Forecasting for New Starts
Travel Forecast TemplateInputs for Special Markets • Project trips per event day • UB hours per event day • Transit passenger miles per event day • Number of event days per year Travel Forecasting for New Starts
Travel Forecast TemplateOther Inputs • Daily project trips • Standard purposes, no special markets • Lowest socio-economic class (representation of transit dependents) • Daily project passenger miles • Standard purposes, no special markets • Transit dependents • Project length (miles) • Annualization factor (days/year) Travel Forecasting for New Starts
Travel Forecast TemplateOutputs-Standard Purposes • Daily new transit trips • % distribution of total new transit trips • % distribution of daily UBs • % distribution of daily baseline transit trips • % UBs lost to capping • % UBs accruing to lowest socio-economic class Travel Forecasting for New Starts
Travel Forecast TemplateOutputs-Special Markets • % distribution of total new special-market annual transit trips • % distribution of total special-market annual UBs • Minutes of UBs per project trip Travel Forecasting for New Starts
Travel Forecast TemplateOutputs-Quality Control Checks • Minutes of UBs per daily project trip • Before capping • After capping • % UBs coverage related • % UBs from special markets • % of project trips that are new transit trips • Project’s average trip distance / project length Travel Forecasting for New Starts
Transit Assignment Results • Production/attraction format • Total riders (linked trips) and boardings (unlinked trips) by mode • Guideway station ONs and OFFs by direction and mode of access • Directional transit rider load volumes between stations • Station to station transit riders Travel Forecasting for New Starts
Ons, Offs, and Load Volumes Travel Forecasting for New Starts
Mode of Access by Station Travel Forecasting for New Starts
Thoughts on Good Practice • Boundaries for summary districts • Changes over time • Changes between alternatives • Thematic maps • Desire-line plots Travel Forecasting for New Starts
Summit Districts • Generally, between 15 and 20 for reporting • Smaller near project; larger elsewhere • Thematic maps of UBs district boundaries • Corridor (for making-the-case discussion) • Aggregations of districts • Perhaps immediate and broader corridors • Different structures for special analysis Travel Forecasting for New Starts
Changes over Time • Identify/justify very high or very low % changes • Comparisons to observed growth trends • Roadway and transit supply checks • Roadway and transit speed checks • Transit passenger PMT and PHT checks Travel Forecasting for New Starts
Changes between Alternatives • Identify/justify large changes in zone to zone mode shares • Examine zone-to-zone pairs with major negative user benefits or high “per rider” positive user benefits Travel Forecasting for New Starts
Thematic Maps • Zonal population, employment, trip end and transit mode share changes • User benefits per impacted transit trip production or attraction • Percent of zone’s transit riders with a change in user benefits • Positives separate from negatives Travel Forecasting for New Starts
Desire Line Plots • District-to-district “bandwidth” lines for those pairs representing 25, 50, and 75% of all user benefits • District-to-district lines for those pairs with some zone-to-zone negative benefits Travel Forecasting for New Starts
7. Lifting the Cap • FTA requirements for New Starts • Background • Analytical approach to adjusting the cap Travel Forecasting for New Starts
FTA Requirements • Cap on per-trip transit user benefits • Applied to CW-CW and MD-MD trips I-J • (“Off-diagonal” UBs handled separately) • Standard cap = ±45 weighted minutes • FTA adjustment of cap • Case-by-case consideration • Based on demonstration of actual project benefits > 45 weighted minutes/trip Travel Forecasting for New Starts
Background • The creature from the swamp – 2002 • Early Summit testing of 12-15 projects • Large problems with most forecasts • Model properties (bizarre guideway constants) • Alternatives (inconsistent baselines) • Prospect of few rated projects in 2002 • “Cap” to salvage some project ratings • Model-related problems large UB/trip • No pending New Starts decision X Travel Forecasting for New Starts
Background • Near-term application • Adjust/remove cap where appropriate • Criteria • Large project-caused user benefits per trip • Absence of large spurious benefits • Longer-term FTA aspiration • The swamp dries up • The creature moves away Soon? Travel Forecasting for New Starts
Analytical Approach • Sources of benefits • Based on best paths, Base and Build • Computation of time savings • TStot = build transit trips x (impedbas – impedbld) • TSivt = build transit trips x (IVTbas – IVTbld) where: imped = total weighted impedance IVT = in-vehicle time Travel Forecasting for New Starts
Analytical Approach • Inspection of time savings • Total versus IVT-caused • Fraction on I-J paths on project • D-to-D trips with large per-trip time savings • Detailed analysis of illustrative paths • Anticipated outcome • ΔIVT usually the cause of most benefits • Project in path for most benefits Travel Forecasting for New Starts
Analytical Approach cap OK May need some clean-up May need explanation Time Savings: Total versus In-Vehicle Time Delta IVT (min.) Requires explanation Distribution of time savings across cells determines course of action Delta Total Weighted Time (min) Travel Forecasting for New Starts
Analytical Approach • Implementation • Custom-written programs • Reporting features of forecasting software? • Summit • Track record on cap increases • Largely IVT-caused: yes increased for all • Largely service-policy caused: no • Largely walk/xfer caused: yes Travel Forecasting for New Starts
Example: NY East-Side Access • Long Island Railroad • Now: to Penn Station only • Project: also to Grand Central Station • Analysis No cap • ~All 45+minute changes to east side • ~All had much shorter walks, many fewer xfers • IVT changes contributed a modest share of UBs Travel Forecasting for New Starts
Summary • Cap exists to ward off swamp creatures • Projects with large per-trip UBs • Demonstration of real project causes • Usually ΔIVT, but not always • Soon(?): routine QC of forecasts will eliminate need to cap Travel Forecasting for New Starts
8. CTPP-based QC Forecasts • FTA requirements for New Starts • Background • Application • Examples Travel Forecasting for New Starts
FTA Requirements • No requirement for sketch QC forecast • Other relevant requirements • Plausible forecasts • Analysis of uncertainties • Potentially desirable applications • Starter lines • Unfortunate track records Travel Forecasting for New Starts
Background • Motivation – to learn from experience • New Starts projects over the past 20 years • Presumption of available insights • Simple model: markets ridership experience • Purpose – to provide a: • Synthesis of accumulated general experience • Readily available & consistent method and data • Low-cost source of a second number • Way to address entirely new park/ride options Travel Forecasting for New Starts
Background • Aggregate Rail Ridership Forecasting (ARRF) Model • Sponsored by FTA; developed by AECOM • Based on recently built projects • Light rail (11 projects) • Commuter rail (9 projects) Travel Forecasting for New Starts
ARRF – Key Elements • CTPP workersij • GIS workersij served by rail line • Home buffers: • 6 mi. PNR station • 2 mi. other station • Work buffers: walk 1 mi. • Model total ridersij on rail Travel Forecasting for New Starts