Download
1 / 38
390 likes | 997 Views
Managing Financial Performance March 18, 2004 "Money talks...but all mine ever says is goodbye.“ --Anon Agenda Chapter 13: Evaluating and Managing Financial Performance Accounting Statements Working-Capital Management Assessing Financial Performance Capital Budgeting

E N D
Managing Financial Performance March 18, 2004
Agenda • Chapter 13: Evaluating and Managing Financial Performance • Accounting Statements • Working-Capital Management • Assessing Financial Performance • Capital Budgeting
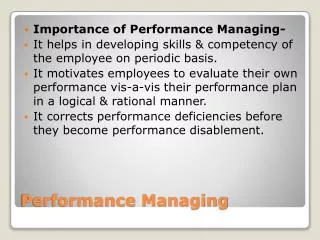
Accounting Statements • Reports of a firm’s financial performance and resources, including an income statement, a balance sheet and a cash flow statement • Help determine a startup’s financial requirements • Assesses the financial implications of a business plan • Provide an accurate picture of operating results. • Permit a quick comparison of current data with prior years’ operations. • Facilitate prompt filing of reports and tax returns to regulatory and tax-collecting agencies. • Reveal employee fraud, waste, and record-keeping errors.
Internal Accounting Controls • A system of checks and balances that safeguards assets and enhances the accuracy and reliability of financial statements. • Types of internal controls • Identifying transactions requiring owner authorization • Ensuring checks issued have supporting documentation • Limiting access to accounting records and computers • Sending bank statements directly to the owner • Safeguarding blank checks • Requiring employees to take vacations
The Income Statement • A report showing the profit or loss from a firm’s operations over a given period of time. • “How profitable is the business?” • Sales – Expenses = Profits • Revenue from product or service sales • Costs of producing product or service (COGS) • Operating expenses (marketing, selling, general and administrative expenses, and depreciation) • Financing costs (interest paid) • Tax payments
The Income Statement Operating Activities Financing Activities Taxes Operating Income Sales Revenue Earnings Before Taxes Interest expense on debt (financing costs) Income taxes Cost of producing or acquiring product or service (cost of goods sold) – – – = Gross profit = = Marketing and selling expenses, general and administrative expenses and depreciation(operating expenses) – Earnings Before Taxes Net Income Available , to Owners = Operating Income
Income Statement Sales revenue $830,000 Cost of goods sold _550,000 Gross profit $290,000 Operating expenses: Marketing expenses $90,000 General and administrative expenses 72,000 Depreciation _28,000 Total operating expenses $190,000 Operating income $100,000Interest expense __20,000 Earnings before taxes $ 80,000 Income tax (25%) 20,000 Net income $ 60,000 Dividends paid $_15,000 Change in retained earnings $ 45,000
The Balance Sheet • A report showing a firm’s assets, liabilities, and owners’ equity at a specific point in time Outstanding debt + Owner’s equity = Total assets
The Balance Sheet: An Overview Debt (Liabilities) and Equity (Net Worth) Assets Current Assets Debt Capital Current Debt Cash Accounts payable Accounts receivable Accrued expenses Inventories Short-term notes Long-term Debt + Long-term notes Mortgages Fixed Assets Machinery andequipment + Buildings and land Owner's Equity Owner's net worth + or Partnership equity or Other Assets Common stock equity Long-terminvestments, patents = = Total Assets Total Debt and Equity
Fit between the Income Statement and Balance Sheet Income statement reports the profits from January 1, 2002 through December 31, 2002 January 1 December 31 2001 Balance Sheet Reports a firm's financial position at beginning of 2002 (end of 2001) 2002 Balance Sheet Reports a firm's financial position at end of 2002
The Cash-Flow Statement • A financial report that shows changes in a firm’s cash position over a given period of time • Accrual-Basis Accounting • A method of accounting that matches revenues when they are earned against the expenses associated with those revenues. • Cash-Basis Accounting • A method of accounting that reports transactions only when cash is received or a payment is made.
Flow of Cash through a Business Owner's Borrowed Sale of Borrowed Investment Funds Fixed Assets Funds Collection of Collection of Cash Accounts Accounts Sales Receivable Receivable Payment of Purchase of Expenses Fixed Assets Payment of Payment for Dividends Inventory
Managing Working Capital • Working Capital Management • The management of current assets and current liabilities • Net Working Capital • The sum of a firm’s current assets (cash, account receivable, and inventories) less current liabilities (short-term notes, accounts payable, and accruals). • Working Capital Cycle • The daily flow of resources through a firm’s working-capital accounts
The Working-Capital Cycle • Purchase or produce inventory for sale, which increases accounts payable. • a. Sell inventory for cash.b. Sell inventory for credit (accounts receivable). • Pay the accounts payable (decreases cash and accounts payable). • Collect the accounts receivable (decreases accounts payable and increases cash). • Begin cycle again
The Working Capital Cycle 1 Purchase Increases Increases inventory or produce accounts payable inventory 2 Sell the Decreases inventory inventory Increases 2a 2b accounts for cash on credit receivable 3b 3a Pay Decreases Pay operating accounts accounts expenses payable payable and taxes 4 Decreases Collect accounts accounts receivable receivable decreases increases increases decreases 5 Cash Begin cycle again
Working-Capital Time Line Order Inventory Cash Collection Placed Received of Receivables Sale Days in Inventory Days in Accounts Receivable a b c d e Days in Accounts Payable Cash Conversion Period Cash Payment for Inventory Cash conversion period—the time required to convert paid-for inventories and accounts receivable into cash. Source: Adapted from Terry W. Maness and John T. Zeitlow, Short-Term Financial Management (New York: Dryden Press/Harcourt Brace, 1998), p. 4.
Three-Month Cash Budget May June July August SeptemberMonthly Sales $100,000 $120,000 $130,000 $130,000 $120,000 Cash receipts Cash sales for month (40%) $ 52,000 $ 52,000 $ 48,000 1 month after sale (30%) 36,000 39,000 39,000 2 months after sale (30%) 30,000 36,000 39,000 Step 1 Total collections $118,000 $127,000 $126,000 Purchases (80% of sales) $104,000 $104,000 $ 96,000 $ 80,000 Cash disbursementsStep 2a Payments on purchases $104,000 $104,000 $ 96,000 Rent 3,000 3,000 3,000 Wages and salaries 18,000 18,000 16,000 Step 2b Tax prepayment 1,000 Utilities (2% of sales) 2,600 2,600 2,400 Interest on long-term note 800 Step 2c Short-term interest (1% of short-term debt) 106 113 Total cash disbursements $128,600 $127,706 $118,313 Step 3 Net change in cash $ 10,600 $ 706 $ 7,687 Step 4 Beginning cash balance 5,000 5,000 5,000 Step 5 Cash balance before borrowing $ 5,600 $ 4,294 $ 12,687 Step 6 Short-term borrowing (payments) 10,600 706 7,687 Ending cash balance $ 5,000 $ 5,000 $ 5,000 Step 7 Cumulative short-term debt outstanding $ 10,600 $ 11,306 $ 3,619
Managing Inventory • Inventory is a “necessary evil.” • Product supply and consumer demand don’t always match up • Reducing Inventory to Free Cash • Monitoring current inventory • Determine age and suitability for sale. • Controlling stockpiles • Match on-hand inventory with demand. • Avoid personalizing the business-customer relationship. • Avoid forward purchasing of inventory; the carrying cost for excess inventory may exceed any savings.
Assessing Financial Performance • Does the firm have the capacity to meet its short-term (one year or less) financial commitments? • Is the liquidity of the firm’s assets sufficient? • Is the firm producing adequate operating profits on its assets? • How is the firm financing its assets? • Are the owners (stockholders) receiving an acceptable return on their equity?
Measuring Liquidity: Approach I Current assets - Inventories = Acid-test ratio Current liabilities • Current Ratio • A measure of a company’s relative liquidity determined by comparing cash and near-cash current assets against the debt (current liabilities) coming due and payable within one year. • Acid-test ratio (quick ratio) • A measure of a company’s liquidity that excludes inventories Current assets = Current ratio liabilities Current
Measuring Liquidity: Approach II • Average Collection Period • The average time it takes a firm to collect its accounts receivable. • Account Receivable Turnover Ratio • The number of time accounts receivable “roll over” during a year. • Inventory Turnover Ratio • The number of times inventories “roll over” during the year.
Measuring Return on Investment Operating incomereturn on investment Operating income = Total Assets • OIROI: A measure of operating profits relative to total assets – a rate of return that is independent of how the company is financed • Operating Profit Margin: The ratio of operating profits to sales, showing how well a firm manages the activities that affect its income.
Measuring Return on Investment • Total Asset Turnover • A ratio of sales to total assets, showing the efficiency with which the firm’s assets are used to generate sales. • Fixed Asset Turnover • A ratio that measures the relationship of sales to fixed assets
Measuring Return on Investment Operating income Sales Operating incomereturn on investment = X Sales Total assets Operating incomereturn on investment Operating income = Total Assets Operating incomereturn on investment Operatingprofit margin Total assetturnover = X • Operating Income Return on Investment
How is the Firm Financing Its Assets? • Financial Leverage • The use of debt in financing a firm’s assets • Can increase ROE but use it wisely! • Debt (or Debt-Equity) Ratio • The ratio of total debt to total assets (or equity) • Times Interest Earned Ratio • The ratio of operating income to interest charges; shows the number of times a firm earns the amount it must pay in interest
Return on Owners’ Investment • Return on equity (ROE) • The rate of return that owners earn on their investment.
Financial Ratios for Retail Computer and Software Stores Source: Adapted from RMA 2001–2002 Annual Statement Studies published by Robert Morris Associates, Philadelphia, Pa. Copyright Robert Morris Associates, 2001.
Return on Invested Capital: An Overview Capital invested by the Firm's firm's creditors becomes total assets and equity investors (owners) Profits and cash flows compute Rate of return on total capital Shared by equals Equity Creditors investors Operating income compute compute Total assets Return on Return on creditor's equity capital capital equals equals Net income Interest rate charged on debt Common equity
Capital Budgeting • An analytical method that helps managers make decisions about long-term investments such as: • Developing new products • Replacing equipment • Constructing new facilities • Expanding sales territories • Seeks to answer the question: • “Do future benefits from the investment exceed the cost of making the investment?” • Good decisions can add value to the firm; bad decisions can put the firm out of business.
Three Rules of Capital Budgeting • Investors judging the attractiveness of an investment prefer: • More cash rather than less cash. • Cash sooner rather than later. • Less risk rather than more risk.
Capital Budgeting Techniques • Capital Budgeting Decisions Involve: • Accounting return on investment • How many dollars in average profits are generated per dollar of average investment? • Payback period • How long will it take to recover the original investment outlay? • Discounted cash flows (net present value or internal rate of return) • How does the present value of future benefits from the investment compare to the investment outlay?
Accounting ROI , , , , 1 000 2 000 2 500 3 000 + + + Accounting returnon investment 4 = , 10 000 0 + 2 2,125 = 0.425, or 42.5% = 5,000 • Accounting ROI • Evaluation of a capital expenditure based on the average annual after-tax profits relative to the average book value of an investment. Initial investment = $10,000 Year After-Tax Profits 1 1,000 2 2,000 3 2,500 4 3,000
Payback Period • Payback period • Measuring the amount of time it will take to recover the cash outlay of an investment. Original Investment = $15,000 Annual Depreciation = $1,500 Acceptable payback period= 5 years Payback period = 4.86 years After-TaxYear Profits 1–2 1,000 3–6 2,000 7–10 2,500 After-Tax Cash Flows 2,500 3,500 4,000 Investment Recovery Year 1-2 Year 3-5 5,000 10,500
Discounted Cash Flows • Discounted Cash Flows (DCF) • An analysis comparing the present value of future cash flows with the cost of the initial investment. • Considers that cash received today is more valuable than cash to be received in the future—the time value of money. • Net present value (NPV) • The current value of cash that will flow from a project over time less the initial investment outlay. • Internal rate of return (IRR) • The rate of return that a firm expects to earn on a project; rate must exceed cost of capital.
A Firm’s Cost of Capital • Cost of Capital • The rate of return required to satisfy a firm’s debt holders and investors. • Opportunity Cost • The rate of return that could be earned on another investment of similar risk. • Weighted Cost of Capital • The cost of capital adjusted to reflect the relative costs of debt and equity financing.
Using the Cost of Debt as an Investment Criterion • Favorable Financial Leverage • A benefit gained by investing at a rate of return that is greater than the interest rate on a loan. • Debt Capacity • The limit at which a firm cannot assume more debt without additional equity investment by its owners.
Capital Budgeting Practices of Small Firms • Factors Affecting the Capital Budgeting Analysis Process: • Nonfinancial (personal) variables • Undercapitalization and liquidity problems • Uncertainty of cash flows within the firm • Lack of established market value for the firm • Small size, scope, and length of firm’s projects • Lack of managerial experience and talent in firm