Download
1 / 23
230 likes | 573 Views
Infrasonic Observations of Earthquakes J. Paul Mutschlecner and R. W. Whitaker Los Alamos National Laboratory 2003 Infrasound Technology Workshop October 27-29, 2003 JaJolla, California. Opinions are those of the authors not of the US government. Overview.

E N D
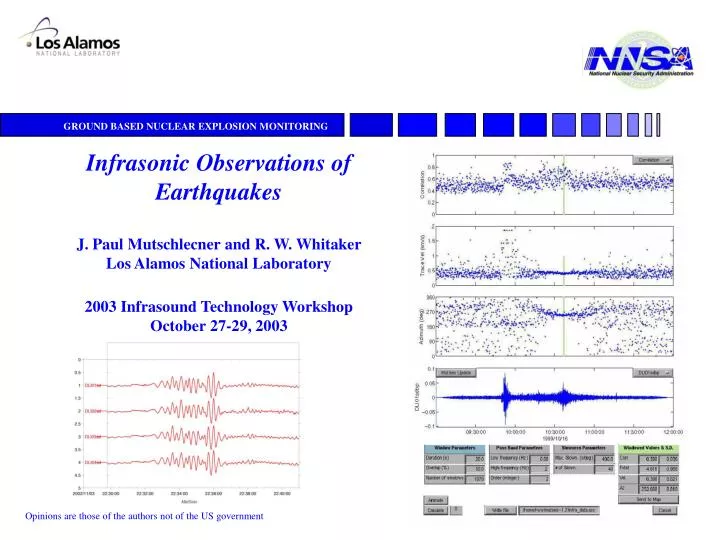
Infrasonic Observations of Earthquakes J. Paul Mutschlecner and R. W. Whitaker Los Alamos National Laboratory 2003 Infrasound Technology Workshop October 27-29, 2003 JaJolla, California Opinions are those of the authors not of the US government
Overview • Review infrasound signals from earthquakes • Understand infrasound signals with respect to earthquake characteristics • Provide estimate for earthquake infrasound signals • Discuss future directions - modeling and earthquake parameterization
Infrasound Earthquake Data Set • Number of earthquake events 30 • Number of signals 47 • Number of stations recording 4 • 1983 - 2002 • 13 multi-station detections • Analysis is ongoing
0.5-3.0 Hz data 2/22/02 M 5.7 32.38 N 115.35W Channel data and Infra_Tool Az Dev 1.7o
< Dq > = 2.94 deg s = 2.33 < Dq> = 1.47 deg s =3.47 Data Set Characteristics
Data Set Characteristics <Dur> = 14.0 min s = 9.4 <f> = 0.84 Hz s = 0.49
Duration (in min) vs Mb Examination of several other parameters Shows no well defined trends Possible indication of range dependence
Long Signal Duration for EQ • Source (EQ) duration • But most Earthquakes have motion over only a few seconds to a minute (aftershocks may contribute for larger Mb • Atmospheric propagation • Usual competition between pulse stretching and dissipation • HE signals of similar size have shorter durations • Source extension by seismic surface waves • Relation to magnitude supports this concept • Known cases of extended sources (eg Coalinga, 1983, and Northridge, 1994) • But for longest durations source must be ~100s km in diameter; and durations are not always symmetric about epicenter signal
Amplitude Scaling for Distance and Stratospheric Wind Where Vd - wind component directed, source to array Vz - zonal component of stratospheric (50 km) wind Vm - meridional component of stratospheric wind q- azimuth to source Distance and wind parameters are empirically derived and b = 1.45 and k = 0.018 See: “An Empirical Study of Infrasound Propagation”, 1999, J. Paul Mutschlecner, Rodney W. Whitaker and Lawrence H. Auer, LA-13620-MS, Los Alamos National Lboratory
Scaled Amplitude vs Mb(all events) • R2 = 0.591 • = 0.419 b = 0.454
Peak Vertical Velocity (at 1 km) and ML40 Events • R2 = 0.595 • = 0.230 b = 0.558 From: “Empirical Analysis of Near-Source Ground Motion,” 1980, A. F. Shakal and D. L. Bernreuter, NUREG/CR-2095 (UCRL-53028)
Statistical Simulations { } denote random variations
Results of Statistical Simulations 50 simulations Monte Carlo approach
Summary • Relations determined • Log(Asc) vs Mb • Duration vs Mb • Frequency vs depth • Uncertainty sources identified and ~ match to observations • Better earthquake source parameterization needed • Source modeling being established
Close-in Ground Motion Velocities for 10/15/79 EQ, Imperial Valley (6.6) From: “Empirical Analysis of Near-Source Ground Motion,” 1980, A. F. Shakal and D. L. Bernreuter, NUREG/CR-2095 (UCRL-53028)
Scaled Amplitude for Best Wind Data • R2 = 0.691 • = 0.405 b = 0.556