Download
1 / 5
50 likes | 163 Views
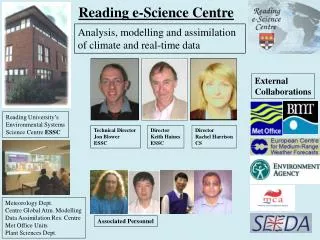
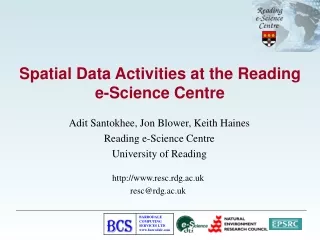
The Reading e-Science Centre. Jon Blower Reading e-Science Centre Environmental Systems Science Centre University of Reading United Kingdom. Background. Formed in Nov 2003 as “Centre of Excellence” for environmental e-Science Joint venture between ESSC and School of Systems Engineering

E N D
The Reading e-Science Centre Jon Blower Reading e-Science Centre Environmental Systems Science Centre University of Reading United Kingdom
Background • Formed in Nov 2003 as “Centre of Excellence” for environmental e-Science • Joint venture between ESSC and School of Systems Engineering • 50% NERC, 50% EPSRC funding hence joint mission to promote e-Science in environmental sciences and locally at Reading • Since Nov 2005, 100% NERC funded • Hence must focus on NERC activities • Although still active locally
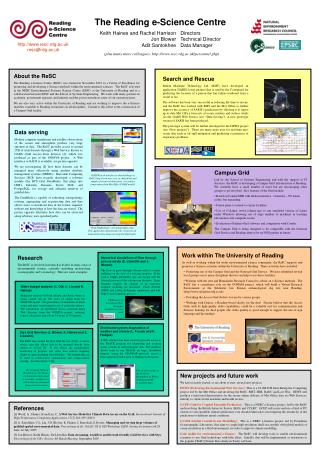
Key activities • Produce software tools for environmental e-Science • Mapping server and interactive website • Secure environmental data server • Linking of NERC clusters at ESSC, Proudman Oceanographic Labs and British Antarctic Survey • Engage with industry and govt agencies • Strong links with British Maritime Technology and Met Office • Research Fellow sponsored by Schlumberger • Encourage uptake of Web Service standards in the community • For greater interoperability • Encourage development and use of local e-Science infrastructure • E.g. Campus Grid • ESSC are key users of current Grid (Kevin Hodges)
Using the Campus Grid: example from ESSC • TRACK program identifies and tracks storms in numerical model output • Identifies pressure lows and vorticity highs • Use Condor to run TRACK over very large numbers of datasets • Datasets are downloaded from the Internet on-demand • Then produce statistics and diagnostics using the results • Tells us about the predictability of storms • Also how storms respond to climate change • Bengtsson et al, 2006 “Storm tracks and climate change” (Journal of Climate) Lizzie Froude, Kevin Hodges, Lennart Bengtsson
Access Grid at ESSC • Internet-based videoconferencing using multicast • Uses InSORS software • Enables distributed meetings between multiple participants • Can share powerpoint slides and other apps • Free to use! • Email us to book accessgrid-resc@rdg.ac.uk