Download
1 / 41
420 likes | 544 Views
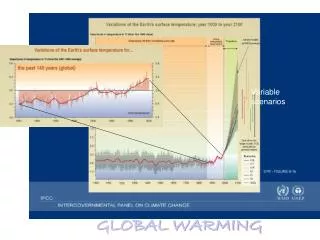
ATM S 111, Global Warming: Understanding the Forecast. Dargan M. W. Frierson Department of Atmospheric Sciences Day 11: 05/04/2010. Assignments. Should have read “Impacts on Ecosystems and Agriculture” p.147-168 Finish reading “Keeping Track” (Climate Records) p.171-192 for next time

E N D
ATM S 111, Global Warming: Understanding the Forecast Dargan M. W. Frierson Department of Atmospheric Sciences Day 11: 05/04/2010
Assignments • Should have read “Impacts on Ecosystems and Agriculture” p.147-168 • Finish reading “Keeping Track” (Climate Records) p.171-192 for next time • Quiz today during second half of class • Better have your scantron and #2 pencil • New extra credit opportunity • Read & write a 1-2 page summary/response of one of the two news articles posted on the class website
Last Time… • Impacts on agriculture • Tropics/subtropics will likely be hit hard • This is where many of the food insecure of the world live • Case study: Indonesia • Example of changes in precipitation leading to decreased food production • Late onset of the monsoon rainy season leads to inability to plant rice a second time as in a normal rainy season • In many tropical locations, temperature is the most important factor • Higher temperature means decreased yields for most staple crops
Today • Climate impacts on the Pacific Northwest (PNW) • Impacts on ecosystems • Specifically terrestrial ecosystems
Pacific Northwest Changes Is the Pac. NW warming? 113 stations with long records Almost every station shows warming Urbanization is not a major source of warming
Temperatures in the Puget Sound There’s lots of decadal variability in our region though
Temperatures in the Puget Sound There’s lots of decadal variability in our region though Decadal changes are mostly due to an oscillation in the ocean called the “Pacific Decadal Oscillation”
Pacific Decadal Oscillation Warm phase Cool phase Pacific Decadal Oscillation is very important for PNW climate: we’ll come back to this
Predictions for Future of PNW • Temperatures will increase • 1-3o C (2-5o F) by 2040, 1.5-5.5o C (3-10o F) by 2080 • Precipitation is uncertain • We’re kind of on the border between drying to the south and moistening to the north • Not clear which of these we’ll experience, or if there will be little change
How about glaciers? Glaciers are affected by both temperatures and snowfall South Cascade Glacier in Upper Skagit River Basin, Washington
Snowpack is Most Important for PNW Society • Glacier melt leads to enhanced warming due to ice-albedo feedback • Also some sea level rise • But otherwise not as important as snowpack • Snowpack = seasonally melting snow • Falls in winter, melts in summer • Important for: • Water resources in the summer • Hydropower
Snowpack Changes With warmer temperatures, more rain falls as snow, and earlier melt Leads to water stress in the summer
Is snowpack declining? • Yes, in much of the western US • Some of this is due to changes in the PDO • Also temperatures are increasing on days with precip in March, and more rain is falling vs snow • Changes in the near future will likely be dominated by PDO. • Global warming will make a more clear mark eventually. • Global warming plus a strong PDO phase: the worst impacts.
Impacts on Ski Industry • Ski conditions at Snoqualmie Pass could degrade in the relatively near future (2025) • Likelihood of opening by Dec 1 reduced by 50% • Average season length declined by 28% • Likelihood of rain when ski area is open increased by 25% • Stevens Pass is at higher elevation and is safer • Likelihood of Dec 1 opening reduced by 25% • Season length declined by 14% • Likelihood of rain when ski area is open increased by 50%
Coasts 50” 40” Rising sea levels will increase the risk of flooding, erosion, and habitat loss along much of Washington’s 2,500 miles of coastline. • Global SLR: 7-23” by 2100 • Medium estimates of SLR for 2100: +2” for the NW Olympic Peninsula +11” for the central/southern coast+13” for Puget Sound • Higher estimates (up to 4 feet in Puget Sound) cannot be ruled out at this time. 30” 20” 13” 10” 6” 6” 3” 2050 2100 Projected sea level rise (SLR) in Washington’s waters relative to 1980-1999, in inches. Shading roughly indicates likelihood. The 6” and 13” marks are the SLR projections for the Puget Sound region and effectively also for the central and southern WA coast (2050: +5”, 2100: +11”).
PNW Sea Level Rise • Sea level rise will be less on the Olympic Peninsula because this area is rising • Due to plate tectonics • Puget Sound may be a little worse • Due to slight sinking of this area
Changing Coastal Flood Risk Increased storm surge and related episodic flooding will present a greater near-term challenge. For much of Puget Sound… • A one foot of sea level rise turns a 100 year flood event into a 10 year event. • A two foot sea level rise turns a 100 year flood event into an annual event. Numbers and photos courtesy of Hugh Shipman, Washington Dept. of Ecology
Risks from SLR Increased risk of: • coastal flooding • inundation of low-lying areas • coastal erosion • salt water intrusion into coastal aquifers • contamination from coastal landfills/toxic sites • loss of nearshore habitat • bluff landsliding Impacts are highly dependent on location and daily to seasonal fluctuations in sea level, not just changes in mean sea level.
Inundation Levels in Olympia from Current and Projected Changes in High Tides A. Tidal datum elevation 18 feet B. Tidal datum elevation 19 feet Olympia has 17 feet tides 2-4 times per year C. Tidal datum elevation 20 feet D. Tidal datum elevation 22 feet
Sea level rise inundation scenarios (two-feet, four-feet, and six-feet) for Harbor Island, Seattle Source: Petersen 2007
Salmon • Salmon are affected by many different factors • Their physical environment • Availability of food • Competitors for food • Predators that prey on salmon • Natural climate variability affects salmon abundance • The Pacific Decadal Oscillation
Pacific Decadal Oscillation (PDO) Warm PDO: left Cold PDO: right
Pacific Decadal Oscillation (PDO) PDO PDO impacts on salmon catches PDO tells you whether they’re biting in Alaska or Washington From Mantua et al (1997) (UW research)
Floods Early peak flows Warm, low streamflow ?? Salmon Impacted Across Full Life-Cycle
Salmon • Important aspects include: • Changes in frequency/magnitude of flood events • High winter flow can lead to flooding out eggs in streambeds • Low flow speed in spring/summer • This takes the juveniles out to sea: if timed wrong or weak flow they may not make it out • Summertime stream temperature • There’s an upper limit of temperature the fish can handle when returning to spawn • Threshold depends on the species • Will likely be important by mid-century
134 lb marlin caught 40 mi. west of Westport, WA, Sept 2, 2005 Photo obtained from the Seattle Times web-archives Species distributions change with temperature, affecting the overall food web From the Seattle Post-Intelligencer, October 20, 2005
American Pika • Lives in mountains in western US/Canada • Makes a distinctive whistling noise • Dense fur, well-suited to cold temperatures
Pikas and Global Warming • Pikas can get heat stroke & die after brief exposure in temperatures above 78 F • Heat can lead to less time for foraging in addition to direct harm • Also lack of insulating snow in the winter can be harmful
Pikas and Global Warming • Local extinctions have occurred in several populations in the US already • They live essentially on high-altitude islands of colder temperatures • Migration to higher altitudes or more northern locations is not always possible
Other Vulnerable Species Worldwide • Amphibians & reptiles • Cold-blooded and close to ground lead to vulnerabilities • Many species are disappearing • Diseases spreading more easily due to climate has been implicated in some extinctions • Often fragmentation of ecosystems, pollutants are to blame for unhealthy populations • Butterflies • Certain species are climbing to higher elevations
“Disrupted Synchrony” • Disrupted synchrony is when things used to happen at the same time, but are shifting • Ex 1: Caterpillars hatching later. Bird no longer hatches at same time that caterpillars are out, so birds go hungry • Ex 2: Plantains in California are dying off earlier due to heat. Caterpillars/butterflies can’t use these as foods.
Parasitic Diseases • Many will likely increase with warmer and moister climates • Malaria: carried by mosquitoes • Cold weather kills mosquitoes • Spreading into regions of African highlands not previously seen • Short-term variations in rainfall is also very important
Insects & Forests • Bark beetle: • Spreading across North America due to warmer winters & increased drought • Montana, Wyoming, Colorado pine forests particularly hard-hit • Often attack already weakened trees (by drought etc) • Bad for timber industry Red trees are damaged by bugs