Download
1 / 49
540 likes | 819 Views
Dive into MRP system output, key components, and types of demand. Learn how MRP determines orders, schedules, and inventory status. Gain insights into BOM and MPS modules essential for production planning.

E N D
Material requirements planning MRP Introduction Input data/Output BOM Calculations dr inż. Joanna Oleśków-Szłapka Poznan University of Technology
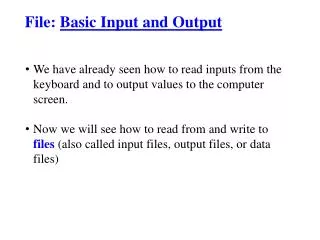
An Overview of MRP CPR module • MRP uses the concept of backward scheduling to determine how much and when to order and replenish • The CRP (Capacity Requirements Planning) module checks to make sure the scheduled work load profile is feasible • The MPS module contains the authorized schedule • The BOM module contains the product structure for each unique product • The Inventory Record module keeps track of the inventory status for each item in the database • MRP output includes schedules for all internal activities and parts as well as orders for all supply chain items
Types of Demand • There are two types of demand. • Independent Demand • Is the demand for finished products • Does not depend on the demand of other products • Needs to be forecasted • Dependent Demand • Is the demand derived from finished products • Is the demand for component parts based on the number of end items being produced and is managed by the MRP system
Material Requirements Planning (MRP) Key Outputs of MRP • Calculate demand for component items • Determine requirements for subassemblies, components, and raw material • Determine when they are needed • Generate work orders and purchase orders • Consider lead times
INPUTS TO AN MRP SYSTEM Bill of Materials (BOMs) Master Production Schedule (MPS) Lot sizes Material on-hand Amount of material to be purchased.
Product Structure Record Clip Assembly (1) Rivets (2) Pressboard (1) Level 0 Clipboard Level 1 Top Clip (1) Bottom Clip (1) Pivot (1) Spring (1) Level 2 Major Inputs to MRP Process:1. Bill of Material • Product structure file • Determines which component items need to be scheduled
Bill of materials - BOM • In order to show the make-up (in terms of the parts needed for production) we have a Bill of Materials (BOM) for the end-product (namely the chair). BOM is a listing of all the subassemblies, intermediates, parts, and raw materials that go into a parent assembly showing the quantity of each required to make an assembly.
Processes that utilize a BOM • Production • Materials planning • Product costing • Plant maintenance
Types of BOMs • Static (fixed) bill • A bill of material for a part that is normally made from the same components, labor and raw materials. • Used for standard assemblies, components, and engineer-to-order customer orders. • Example: • A bill of materials for a standard chair
Types of BOMs • Dynamic (parametric) bill • A bill of material for a product or part for which size, color, laminate, and other options can be selected. • Example: • A bill of materials for a Dell computer
Types of BOMs • Single level bill of material • A bill of material that lists the materials, parts and labor required to make another part. • Example: • A bill of materials to make a Dell computer
Types of BOMs • Multilevel bill of material • A bill of material that lists the components, assemblies, and materials required to make a part, the components, assemblies, and materials required to make each component and assembly of the part, and so forth. • Example: • A BOM for the battery inside the Dell computer.
What information is on a BOM? • Quantity • Item ID# • Description of Item • Cost of Item • Total Project Cost
Quantity • Tells user how many of each part is needed for each project • Example: • A chair needs 1 seat, 4 legs, 1 back, and 5 nails.
Item ID # • Tells us which part to order • Can be any of the following: • Catalog number, UPC, or any other identification number. • Example: • The chair needs a 2PC seat, 5DR legs, 6TU8 back, and 1 inch nails.
Description of Item • Provides a check that the correct item is being ordered.
Cost of Item • Cost is included to show how much each part is per item and the total cost of all like parts. • Example: • The cost of a leg is $5 per leg. Then the total price of the legs ordered would be $20 because there are 4 legs.
Total Project Cost • Shows the total cost of all items and is also the total cost of the direct materials used in the project. • Example: • Seat-$10, Back-$5, Leg-$5 per leg, Nail-$.5 per nail • Total Cost of a chair = 10 + 5 + 5*4 + .5*5 = $37.50
BOM Example Quantity ID# Description Unit Price Total Cost 1 6TU8 Back $5/Unit $ 5.00 4 5DR Legs $5/Unit 20.00 1 2PC Seat $10/Unit 10.00 5 1” Nails $0.50/Unit 2.50 Total Project Cost $37.50
Major Inputs to MRP Process:2. Master Production Schedule(MPS) • Drives MRP process with a schedule of finished products • Quantities represent production not demand • Quantities may consist of a combination of customer orders & demand forecasts • Quantities represent what needs to be produced, not what can be produced • Example PERIOD MPS ITEM 1 2 3 4 5 Clipboard 85 95 120 100 100 Lapdesk 0 50 0 50 0 Lapboard 75 120 47 20 17 Pencil Case 125 125 125 125 125
Major Inputs to MRP Process:3. Inventory Record Contains an extensive amount of information on every item that is produced, ordered, or inventoried in the system DESCRIPTION INVENTORY POLICY Item Pressboard Lead time 1 Item no. 734 Annual demand 5000 Item type Purch Holding cost 1 Product/sales class Comp Ordering/setup cost 50 Value class B Safety stock 0 Buyer/planner RSR Reorder point 39 Vendor/drawing 07142 EOQ 316 Phantom code N Minimum order qty 100 Unit price/cost 1.25 Maximum order qty 500 Pegging Y Multiple order qty LLC 1 Policy code 3
On hand inventory ZD1 – on hand inventory – 1st version Zm – stock ZD2 - on hand inventory – 2nd version ZD3 - on hand inventory – 3rd version ZD4 - on hand inventory – 4th version Zt – stock in the transport R- reservations of the material Zz- safety stock On hand inventory can be calculated according to four following rules - ZD1 = Zm - ZD2 = Zm + ZT ZD2 = ZT - ZD3 = (ZD1, ZD2) – R - ZD4 = (ZD1, ZD2, ZD3) - ZZ
MRP Processes – 4 Basic Steps • Exploding the bill of material • ___________________________________ • Netting out inventory • ___________________________________ • ___________________________________ • Lot sizing rule – How many units • ___________________________________ • ___________________________________ • ___________________________________ • Time-phasing requirements • ___________________________________
Lot Sizing Rules – Classic methods proposed by J. Orlicky – the will be explained in the next lecture • Fixed Order Quantity • Economic Order Quantity- EOQ • Lot for Lot • Fixed Period Requierements • Period Order Quantity- POQ • Least Unit Cost- LUC • Least Total Cost- LTC • Part Period Balancing- PPB • Wagner-Whitin algorithm
MRP Matrix Gross Requirement • Derived from planned order releases of the parent • Actual / estimated demand, in case of final product Schedule Receipts • Items on order • Scheduled to arrive in the future time period Projected on hand • Current inventory, or anticipated inventory at the end of period Inventory on-hand at end of period t - 1 Scheduled / planned receipts in period t Gross requirements in period t Projected on-hand Inventory at end of period t = + -
MRP Matrix Net requirements • Actual quantity to produce based on projected on hand and on-order quantity Planned Order Receipts • Quantity, when orders need to be received • Consider lot sizing rule: Planned Order Release • When order need to be placed to receive on time • Consider lead time
ITEM NAME OR NO. PERIOD LOT SIZE LT 1 2 3 4 5 MRP Matrix
ITEM: CLIPBOARD LLC: 0 PERIOD LOT SIZE: L4L LT: 1 1 2 3 4 5 Gross Requirements 85 95 120 100 100 Scheduled Receipts 175 Projected on Hand 25 Net Requirements Planned Order Receipts Planned Order Releases Example MRP Matrix
L4L LT=1
MRP schedule Lead time – 3 weeks Batching rule: Fixed order quantity – 25 pcs/lot On-hand stock – 20 pcs/lot
LOT SIZE = 120 units/deliverySafety stock = 25Lead time = 1 day, on hand = 100
Example • Company X produce tables (production schedule given in table 1). Each table consists of a top, four legs. Each leg consists of 1 wooden beam, 2 fastenings, 1 pad. Each top consists of 2 boards, 4 fastenings. Each fastening consists of 1 dowel and 1 screw with cap. • The following table 2 gives lead times, on-hand inventory, lot size technique and scheduled receipts. • Construct a product structure (BOM) • Prepare a material planning schedule for the table
TABLE EOQ= 100 LT=1 ON HAND = 100 MRP schedule
TOP L4L, LT=1, on hand=100
LEGS LT= 1 Lot for lot On hand= 30 GROSS REQUIREMENTS = PLANNED ORDER RELEASE FROM TABLE * 4 LEGS
Evolution of MRP • MRP (material requirements planning) was the precursor to ERP • Primarily a production planning and control system • MRP evolved to MRP II (manufacturing resource planning) • ERP (Enterprise Resource Planning) and ERP II continue to extend the links through all business processes
Enterprise Resource Planning (ERP)An Overview • Organizes and manages a company’s business processes by sharing information across functional areas • Connects with supply-chain and customer management applications • ERP in the nutshell* • Client server software • Integrates majority of business processes • Processes majority of transactions • Enterprise wide database • Real time data access * adapted from e-courseware, MIT Sloan
Finance & Accounting Sales & Marketing Production & Materials Management Human Resources ERP Modules[Figure 12.2 ERP’s Central Database] ERP Data Repository
ERP Implementation Process • First step is to analyze business processes • Which processes have the biggest impact on customer relations? • Which process would benefit the most from integration? • Which processes should be standardized? • Use of Internet portals can aid implementation