Download
1 / 27
270 likes | 279 Views
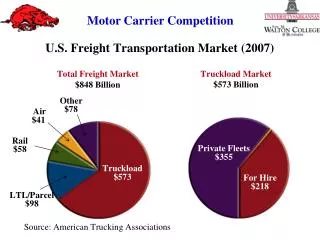
Motor Freight Transportation. Author:. U.S. Mode Shares, 1993. U.S. Mode Comparison, 1993. U.S. Trucking Industry. Exclusively serves 70% U.S. Communities Employees: 9.6 million Truck drivers: 3 million Local and Over-the-Road [OTR] Fuel: 29 billion gallons diesel per annum

E N D
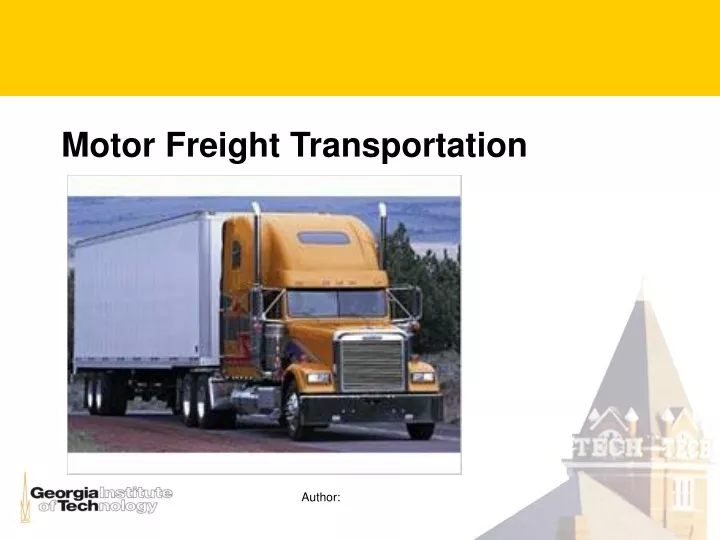
Motor Freight Transportation Author:
U.S. Trucking Industry • Exclusively serves 70% U.S. Communities • Employees: 9.6 million • Truck drivers: 3 million • Local and Over-the-Road [OTR] • Fuel: 29 billion gallons diesel per annum • Miles traveled: 428 billion • 116 billion by Class 8 vehicles
US Deregulation: Motor Carrier Act (1980) • History • Regulation began 1935: Interstate Commerce Commission • Strong railroad lobby • Certificated carriers for specific routes: trafficking • Removal of barriers to entry • Relaxed contract carriage rules • Results • Route restructuring • Market competition and decreased prices • Enabling of new services: intermodal • Enabling of modern lean manufacturing
U.S. Trucking Industry Growth • Increasing in importance • Freight transport revenue share • 68% in 1960 • 81% in 1997 • Continuing growth • Lean supply chains; just-in-time • Ecommerce • Primary beneficiaries: Parcel, LTL, Air freight
Examples: ranked by 1998 revenue • Truckload firms • Schneider National (3), J.B. Hunt (7), Swift (14), Werner (15) • Less-than-truckload firms • Yellow (2), Roadway (4), Consolidated Freightways (5), Con-Way (8), ABF (9), Overnite (11), American Freightways (12) • Household goods firms • United Van Lines (10), North American (13)
Dominant revenue producers • Electronics, instruments, vehicles: $953MM, 55% share • Base metals and machinery: $831MM, 80% share • Wood products, textiles, leathers: $764MM, 78% share • Furniture and other manufactured products:$601MM, 77% share • Grains, alcohol, and tobacco: $556 MM, 93% share • Pharmaceutical and chemical products: $546 MM, 74% share
Export trucking • Grown in importance with NAFTA • Trend: Mexican manufacturing facilities • 20% of export freight revenue • 11% of export tons • Primary commodities: • Electronics, instruments, vehicles: $49 MM • Base metal and machinery: $23MM • Gateways: Laredo, El Paso, San Diego
Truckload operations • Direct origin-to-destination service • No equipment changes • No intermediate terminals required • General vs. specialized • Refrigerated vans (“reefers”), automobile transports, grain carriers • Planning issues • Supply-demand balancing (backhauls, empty repositioning) • Driver issues (relays, home stays)
Less-than-Truckload (LTL) operations • Small shipments • 250 to 12,000 lbs. • Cube (volume) is usually constraint on vehicle packing • Hub-and-spoke networks • Consolidation and rerouting role of terminals • Planning issues • Network design • Routing and scheduling problems
Equipment types in fleets • Single-unit trucks: 68% • Delivery vans, tank trucks, dump trucks, cement mixers • Tractor-semitrailer combination: 26% • Often, “18-wheelers” • Lengths (US): 40 to 53 foot • Multi-trailer combinations: 6% • STAA doubles: twin 28’ trailers • Longer combination vehicles: Rocky Mt Doubles, Turnpike Doubles, Triples
Intermodalism • Economics • Can be slower • Origin and destination drayage • Huge cost savings in driver pay • Long-haul trips • 500-700 miles • Hub-to-hub trips in LTL and package express trucking • TOFC vs. COFC • Equipment investment and management vs. price
TOFC • Trailer-on-flatcar • 28’ Highway trailers
Trends • Value-added • Tracking and tracing, online quotes and service requests • Dedicated contract carriage • Replacement for private carriage: outsourced • Time-sensitive transportation • Expedited options: FAST • Time-definite delivery: RELIABLE • 3PL Services • Warehousing, distribution management, handling