Download
1 / 27
980 likes | 2.9k Views
DEMAND FORECASTING TECHNIQUES. Qualitative & Quantitative . Outline. Introduction Demand Forecasting Forecasting Techniques Qualitative Methods Quantitative Methods Components of Time Series Data Time Series Forecasting Methods Forecast Accuracy Useful Forecasting Websites

E N D
DEMAND FORECASTING TECHNIQUES Qualitative & Quantitative
Outline • Introduction • Demand Forecasting • Forecasting Techniques • Qualitative Methods • Quantitative Methods • Components of Time Series Data • Time Series Forecasting Methods • Forecast Accuracy • Useful Forecasting Websites • Collaborative Planning, Forecasting, & Replenishment (CPFR) • Software Solutions
Introduction • Importance of managing demand in especially in pull manufacturing environments. • Suppliers must find ways to better match supply & demand to achieve optimal levels of cost, quality, & customer service • enables them to compete with other supply chains. • Improved forecasts benefit all trading partners in the supply chain • Mitigates supply-demand mismatch problems
Demand Forecasting • Forecast • estimate of future demand • provides the basis for planning decisions • Goal is to minimize forecast error • Managing demand requires timely & accurate forecasts • Good forecasting • provides reduced inventories, costs, & stockouts, • improves production plans • improves customer service
Forecasting Techniques • Qualitative forecasting is based on opinion & intuition. • Quantitative forecasting uses mathematical models & historical data to make forecasts. • Time series models are the most frequently used among all the forecasting models. • Cause & Effect models assume that one or more factors (independent variables) predict future demand.
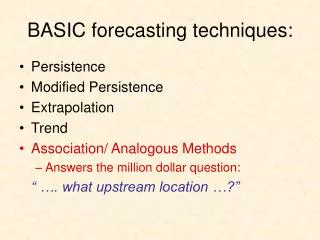
Qualitative Forecasting Methods • Generally used when data are limited, unavailable, or not currently relevant. • Forecast depends on skill & experience of forecaster(s) & available information. Four qualitative models used are: • Jury of executive opinion • Delphi method • Sales force composite • Consumer survey
Quantitative Methods • Time series forecasting- based on the assumption that the future is an extension of the past. Historical data is used to predict future demand. • Cause & Effect forecasting- assumes that one or more factors (independent variables) predict future demand. • It is generally recommended to use a combination of quantitative & qualitative techniques.
Components of Time Series • Data should be plotted to detect for the following components: • Trend variations: increasing or decreasing • Cyclical variations: wavelike movements that are longer than a year (e.g., business cycle) • Seasonal variations: show peaks & valleys that repeat over a consistent interval such as hours, days, weeks, months, years, or seasons • Random variations: due to unexpected or unpredictable events
Time Series Forecasting Naïve Forecast- the estimate of the next period is equal to the demand in the past period. Ft+1 = At Where Ft+1 =forecastforperiodt+1 At = actual demand for period t
Time Series Forecasting Simple Moving Average Forecasting Uses historical data to generate a forecast. Works well when demand is stable over time.
Time Series Forecasting Models Weighted Moving Average Forecasting Model- based on an n-period weighted moving average, follows:
Time Series Forecasting Models Exponential Smoothing Forecasting Model-a type of weighted moving average. Only two data points are needed. Ft+1 = Ft+(At - Ft) or Ft+1 = At + (1 – ) Ft Where Ft+1 = forecast for Period t + 1 Ft = forecast for Period t At= actual demand for Period t = a smoothing constant (0 ≤ ≤1).
Time Series Forecasting Models Linear Trend Forecasting Model. The trend can be estimated using simple linear regression to fit a line to a time series. Ŷ = b0 + b1x where Ŷ = forecast or dependent variable x = time variable b0 = intercept of the line b1 = slope of the line
Cause & Effect Models One or several external variables are identified that are related to demand Simple regression. Only one explanatory variable is used & is similar to the previous trend model. The difference is that the x variable is no longer time but an explanatory variable. Ŷ = b0 + b1x where Ŷ = forecast or dependent variable x = explanatory or independent variable b0 = intercept of the line b1 = slope of the line
Cause & Effect Models Multiple regression. Several explanatory variables are used to make the forecast. Ŷ = b0 + b1x1 + b2x2 + . . . bkxk where Ŷ = forecast or dependent variable xk= kth explanatory or independent variable b0 = intercept of the line bk = regression coefficient of the independent variable xk
Forecast Accuracy The formula for forecast error, defined as the difference between actual quantity & the forecast, follows: Forecast error, et = At - Ft where et = forecast error for Period t At = actual demand for Period t Ft = forecast for Period t
Forecast Accuracy Several measures of forecasting accuracy follow: • Mean absolute deviation (MAD)- a MAD of 0 indicates the forecast exactly predicted demand. • Mean absolute percentage error (MAPE)- provides a perspective of the true magnitude of the forecast error. • Mean squared error (MSE)- analogous to variance, large forecast errors are heavily penalized
Forecast Accuracy Mean absolute deviation (MAD)- a MAD of 0 indicates the forecast exactly predicted demand. • where • et = forecast error for period t • At = actual demand for period t; • n = number of periods of evaluation
Forecast Accuracy Mean absolute percentage error (MAPE)- provides a perspective of the true magnitude of the forecast error. • where • et = forecast error for period t • At = actual demand for period t; • n = number of periods of evaluation
Forecast Accuracy Mean squared error (MSE)- analogous to variance, large forecast errors are heavily penalized Where et = forecast error for period t n = number of periods of evaluation
Forecast Accuracy Running Sum of Forecast Errors (RSFE) indicates bias in the forecasts or the tendency of a forecast to be consistently higher or lower than actual demand. Running Sum of Forecast Errors, RSFE = Where et = forecast error for period t
Forecast Accuracy Tracking signal determines if forecast is within acceptable control limits. If the tracking signal falls outside the pre-set control limits, there is a bias problem with the forecasting method and an evaluation of the way forecasts are generated is warranted. Tracking Signal =
Useful Forecasting Websites • Institute for Forecasting Education www.forecastingeducation.com • International Institute of Forecasters www.forecasters.org • Forecasting Principles www.forecastingprinciples.com • Stata (Data analysis & statistical software) www.stata.com/links/stat_software.html