Download
1 / 7
70 likes | 79 Views
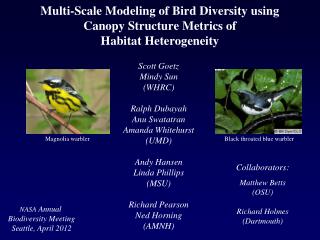
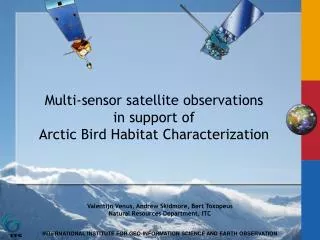
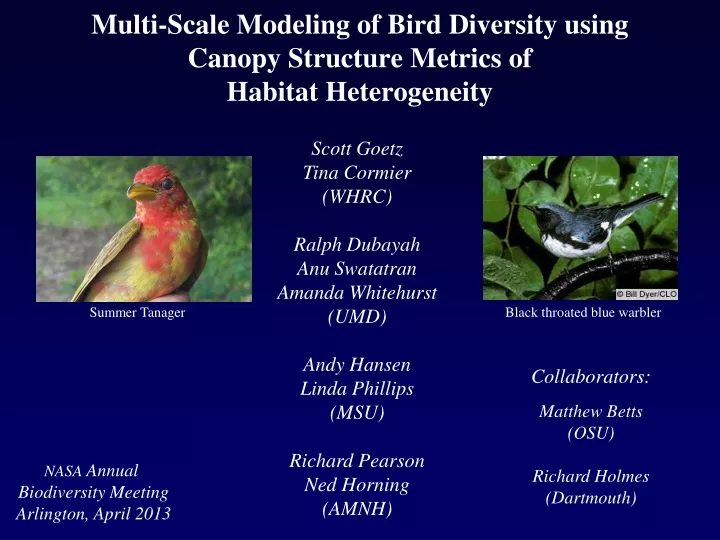
Multi-Scale Modeling of Bird Diversity using Canopy Structure Metrics of Habitat Heterogeneity. Scott Goetz Tina Cormier (WHRC) Ralph Dubayah Anu Swatatran Amanda Whitehurst (UMD) Andy Hansen Linda Phillips (MSU) Richard Pearson Ned Horning (AMNH). Summer Tanager.

E N D
Multi-Scale Modeling of Bird Diversity using Canopy Structure Metrics ofHabitat Heterogeneity Scott Goetz Tina Cormier (WHRC) Ralph Dubayah Anu Swatatran Amanda Whitehurst (UMD) Andy Hansen Linda Phillips (MSU) Richard Pearson Ned Horning (AMNH) Summer Tanager Black throated blue warbler Collaborators: Matthew Betts (OSU) Richard Holmes (Dartmouth) NASA Annual Biodiversity Meeting Arlington, April 2013
Local scale: we can map multi-year use of breeding habitat with lidar.. Hubbard Brook Experimental Forest Black throated blue warbler
Synergistic use of lidar, moderate to high resolution optical & SAR.. Hubbard Brook Experimental Forest 0 5 10 15 20 25 >30 m LVIS RH100 DRL Canopy Height 0 5 10 15 20 25 >30 m UAVSAR Landsat NDVI difference 0 0.6
More at Local Scale: Boosted Regression Tree Hurdle Model Predictions of Species Abundance at HBEF Good prediction… Reasonable prediction… Poor prediction… Black-throated blue warbler, r2=0.497 Brown Creeper, r2=0.049 Magnolia Warbler, r2=0.756 Mean r2 for 16 species = 0.381, Max = 0.756, Min = 0.039. Pearson et al. (forthcoming)
National Scale: Predictions of Bird Species RichnessBiophysical Structure and Environmental predictors Forest All Grassland Woodland Models developed on BBS routes Goetz et al. (forthcoming)
These results support theory that different ecological processes operate at different spatial scales... Canopy structure Pearson & Dawson (2003) Global Ecology and Biogeography 12: 361-371; see also: McGill (2010) Science 328: 575-576
Derivation of cover at multiple canopy heights / layers Canopy cover at 10_15m