Download
1 / 24
240 likes | 363 Views
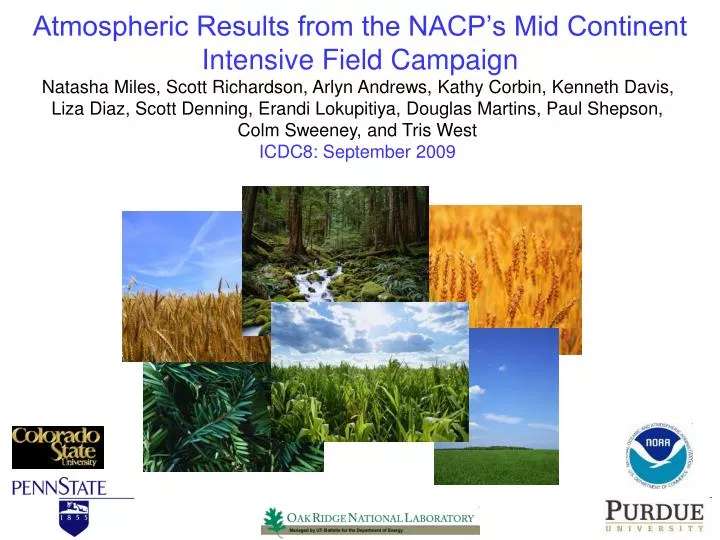
Atmospheric Results from the NACP’s Mid Continent Intensive Field Campaign. Natasha Miles, Scott Richardson, Arlyn Andrews, Kathy Corbin, Kenneth Davis, Liza Diaz, Scott Denning, Erandi Lokupitiya, Douglas Martins, Paul Shepson, Colm Sweeney, and Tris West ICDC8: September 2009.

E N D
Atmospheric Results from the NACP’s Mid Continent Intensive Field Campaign Natasha Miles, Scott Richardson, Arlyn Andrews, Kathy Corbin, Kenneth Davis, Liza Diaz, Scott Denning, Erandi Lokupitiya, Douglas Martins, Paul Shepson, Colm Sweeney, and Tris West ICDC8: September 2009
Atmospheric results from the NACP’sMid Continental Intensive Rosemount LEF • Overall goal of Mid-Continental Intensive: Seek convergence between top-down and bottom-up estimates of the regional flux • “Oversample” the atmosphere in the study region • Atmospheric results • Purdue Univ / NOAA ALAR (aircraft) Campaign • NOAA aircraft program • 9 tower sites (NOAA, PSU, U of Minn) • NOAA Carbon Tracker • CSU SiBcrop-RAMS model • Comparisons to agricultural and satellite data ~ 500 km
NOAA / Purdue University ALAR Regional Survey 15 – 25 June 2007 Colm Sweeney (NOAA/ESRL) Paul Shepson (Purdue University) Doug Martins (Purdue University) 385 ppm Front 365 ppm 17 June 2007 15 June 2007
NOAA / Purdue University ALAR Lagrangian Flux Estimates: 19 June 2007 Tower-based eddy covariance fluxes from the Brooks Field Site near Ames, IA Flux tower: soybeans Flight Path Flux tower: corn Regionally-averaged aircraft CO2 flux Flux = -10.3±2.4 μmol/m2/s In-situ Profiles Martins et al., 2009
NOAA Aircraft Program CO2 Measurements 8000 8000 8000 8000 • Climatology of 12 of 16 currently running NOAA aircraft project sites • 2 – 3 profiles / month at each site • Increase in amplitude of the seasonal cycle from west to east 18 CO2 (ppm) Altitude (m) 4000 4000 4000 4000 0 200 200 200 200 -15 8000 8000 0 6 12 0 6 12 0 6 12 0 6 12 18 CO2 (ppm) Altitude (m) 4000 4000 0 200 200 -15 8000 8000 0 6 12 0 6 12 18 CO2 (ppm) Altitude (m) 4000 4000 0 200 200 -15 8000 8000 8000 8000 0 6 12 0 6 12 CO2 (ppm) 18 Altitude (m) 4000 4000 4000 4000 0 200 200 200 200 -15 0 6 12 0 6 12 0 6 12 0 6 12 C. Sweeney (NOAA) Deviation from global mean [CO2]
NOAA tall towers in MCI region • Non-dispersive infrared spectroscopy (LiCor, Inc.) instruments • LEF (1994 – current) • WBI (July 2007 – current) PSU Ring 2 towers • Network of 5 cavity ring-down spectroscopy (Picarro, Inc.) instruments surrounding Iowa (April 2007 – October 2009) • Centerville, IA • Galesville, WI • Kewanee, IL • Mead, NE • Round Lake, MN • Additional well-calibrated site on Ameriflux tower at Missouri Ozarks, MO Rosemount LEF U. Of Minn Rosemount* tower • Tunable diode laser instrument • May 2007 – current * data courtesy of T. Griffis
Spatial differences / gradients during 2007 growing season on a daily time scale • Large differences / gradients for some site pairs • West Branch - Centerville Difference Gradient
Spatial differences / gradients during growing season on a daily time scale • Large differences / gradients for some site pairs • West Branch - Centerville (160 km) • Other site pairs: lower differences / gradients • Mead – Centerville(300 km) • Median differences:6.0and 1.7 ppm • Median gradients:0.04and 0.006 ppm/km Difference Gradient
Seasonal cycle • Large variance in seasonal drawdown, despite being separated by ~ 500 km • 2 groups: 33 – 39 ppm drawdown and 24 – 29 ppm drawdown (difference of about 10 ppm) Mauna Loa wbi aircraft * NOAA (Andrews/Sweeney) ** U of Minn (Griffis)
Seasonal cycle • Large variance in seasonal drawdown, despite being separated by ~ 500 km • 2 groups: 33–39 ppm drawdown and 24 – 29 ppm drawdown (difference of about 10 ppm) Mauna Loa wbi aircraft * NOAA (Andrews/Sweeney) ** U of Minn (Griffis)
Seasonal cycle • Large variance in seasonal drawdown, despite being separated by ~ 500 km • 2 groups: 33 – 39 ppm drawdown and 24 – 29 ppm drawdown (difference of about 10 ppm) Mauna Loa wbi aircraft * NOAA (Andrews/Sweeney) ** U of Minn (Griffis)
Corn NPP in the Mid Continental Intensive region: 2007 T. West
Corn NPP in the Mid Continental Intensive region: 2007 Sites with larger seasonal [CO2] drawdown - Consistent with “Corn belt” according to NPP T. West
Model-data comparisons (forwards results) • SiBcrop-RAMS (K. Corbin; A. Schuh; E. Lokupitiya; A.S. Denning) • June-August 2007 • Regional • Coupled with crop phenology model for corn and soybean developed by Lokupitiya et al. (2009); *wheat to be added • NOAA-ESRL Carbon Tracker (A. Andrews; A. Jacobson) • 2007 • Global • Optimized to best fit data on global obs network (not including Ring 2) wheat* corn soy http://carbontracker.noaa.gov
Observations vs Carbon Tracker: 2007 • Overall drawdown in CT 2008 is too weak • But some features of modeled variability are consistent with obs- large variability- mm has less drawdown than wbi, rl, and kw in both model and obs
Observations vs Carbon Tracker: 2007 Obs - model (ppm) 2007 • Suggestive that CT model could be improved by adding crop details • Trajectory analysis: LEF residuals large for southerly trajectories, small for northerly trajectories Corn belt sites Liza Diaz (PSU)
Observations vs SiBcrop-RAMS: 2007 growing season growing season • Overall drawdown compares well • Problems with spatial distribution
Observations vs SiBcrop-RAMS: 2007 growing season Obs – model (ppm) • Problems with spatial distribution • Corn belt sites: not enough drawdown • Centerville, LEF: too much drawdown • Using more realistic percentages for land cover, especially for corn, may improve results Corn belt sites
Seasonal cycle: interannual variability • West Branch (wbi) and Centerville (ce) differ significantly from 2007 to 2008 • From agricultural statistics (NASS), total estimated NPP of corn (T. West) 222 PgC for 2007 207 PgC for 2008 Mauna Loa wbi aircraft * NOAA (Andrews/Sweeney) ** U of Minn (Griffis)
Cedar Rapids, IA Don Becker (USGS) Dell Creek breach of Lake Delton, WI U.S. Air Force Flooding in the Midwestern U.S.: June 2008
Delay in seasonal drawdown 2008 • 2008 [CO2] minima is delayed by 2 – 4 weeks, compared to 2007 • Effect of flood? 2007 2007 solid 2008 dashed
Satellite-based Normalized Difference Vegetation Index (NDVI) for Iowa crops T. West
Normalized Difference Vegetation Index (NDVI) for Iowa crops • Satellite-based: 2-week delay of phenological curve for 2008 compared to 2007, for both corn and soy T. West
Summary • Aircraft and tower results both indicate large spatial gradients between sites despite relatively small site separations • Seasonal cycle: • Difference amongst sites, some with very large seasonal drawdown • Comparisons of tower obs to CarbonTracker and SiBcrop-RAMS • Important to model agriculture correctly • Transport important also • Interannual variability: flooding in June 2008, atmospheric data corroborated by satellite and agricultural statistics data • What spatial density of tower measurements is necessary? To be answered by including subsets of the Ring 2 data in the inversions Natasha Miles Penn State University nmiles@met.psu.edu