Download
1 / 20
840 likes | 2.45k Views
Real-Time PCR (Quantitative PCR). Goals. Understand the fundamental difference between qPCR and traditional PCR Understand the basic quantification method using of qPCR Understand differences between qPCR and Northern blotting. Applications of real-time PCR.

E N D
Goals • Understand the fundamental difference between qPCR and traditional PCR • Understand the basic quantification method using of qPCR • Understand differences between qPCR and Northern blotting
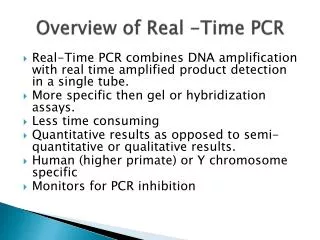
Applications of real-time PCR • Powerful and reliable quantitative method • Gene expression • Determination/monitoring of viral load • Quantification of cancer genes • Microarray verification • Transgenic copy • SNP analysis
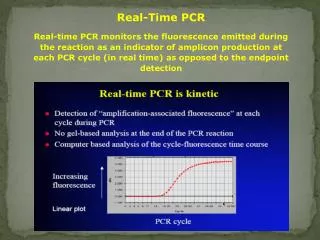
Steps of real-time PCR • Three phases Plateau phase Amount of PCR product Linear phase Exponential phase PCR cycle number
Exponential amplification of PCR Xn= X0 * (1 + E) n E = [10(–1/slope)] – 1 (Efficiency = 1 during exponential amplification) Xn = DNA copies at cycle n X0 = DNA copies at cycle 0 E = efficiency of amplification n = cycle number
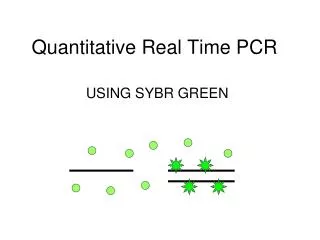
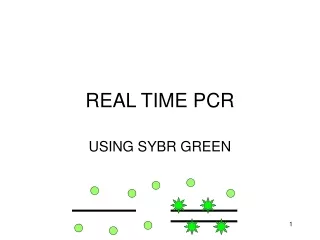
Quantitative detection system • Fluorescence detection system • Two types of fluorochromes • DNA binding dye • Probe-based fluorochromes
SYBR green (DNA binding dye) SYBR green Most commonly used
Probe-based fluorochromes (FAM, VIC, TET, FRET) Less commonly used now Fluorophore Quencher
Vs. Probe-based Fluoro. SYBR green • Does not discriminate between the gene of interest and other DNAs (i.e. contamination) • Does not allow to do multiplex PCR • Requires less steps • Less costly • Does discriminate, more specific • Allows multiplex PCR with usage of different fluoro. • Requires multiple steps • More costly
Detection zones qPCRvs PCR Traditional PCR with EtBr Amount of PCR product PCR cycle number qPCR
Amplicon quantification by qPCR • Fluorescence increase is proportional to DNA amplification • The first cycle at which the instrument can distinguish the amplified fluorescence as being above the background level is called the threshold cycle or “Ct”
The threshold cycle (Ct) Example of a Ct curve Ct
The threshold cycle (Ct) Ct curves of three different samples.
The threshold cycle (Ct) • The Ct value is inversely proportionalto the starting concentration of the sample • i.e. the greater the amount of DNA in the sample the lower the Ct value
Quantification methods • Absolute quantification • To determine exact amounts of DNA (e.g. viral load) • Relative quantification • To determine changes in gene expression
Absolute quantification • If initial amount of DNA copies is known: XT = X0 * (1 + E) Ct • If not, Ct values of the samples has to be compared to a standard curve XT = DNA copies at threshold X0 = DNA copies at cycle 0 E = efficiency of amplification Ct = threshold cycle
Absolute quantification Sample of Mel1 gene which had a Ct of 22.5 cycles after amplification. What is the concentration of your amplicon?
Absolute quantification Concentration of Mel1amplicon withCt of 22.5 y = -3.1392 x + 18.221 22.5 = -3.1392 x + 18.221 x = -1.3630 10 -1.3630 (inverse Log 10) The DNA concentration is 0.043 µg/ml
Relative quantification • Normalization of the gene of interest to a housekeeping gene Sample Housekeeping Ratio
Vs. Northern blotting Real-time PCR • More sensitive (need ~50 ng) • More accurate (can determine numbers) • DNA template (stable) • Doesn’t give size of transcripts • Faster (few hours) • Requires less steps • Less costly • Less sensitive (need ~10 ug) • Less accurate (cannot determine copy numbers) • RNA template (unstable) • Gives size of transcripts • Long (hours to days) • Requires numerous processing steps • More costly