Download
1 / 27
310 likes | 592 Views
Remote Sensing of Forest Structure. Van R. Kane School of Forest Resources. Lecture 18 – Forest remote sensing. Wednesday’s lecture Mars spectroscopy Today’s lecture: Forest remote sensing. LECTURES Jan 05 1. Intro Jan 07 2. Images Jan 12 3. Photointerpretation

E N D
Remote Sensing of Forest Structure Van R. Kane School of Forest Resources
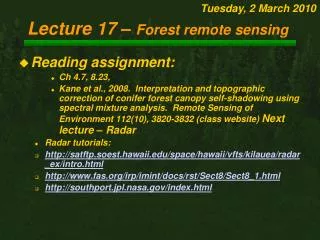
Lecture 18 – Forest remote sensing • Wednesday’s lecture • Mars spectroscopy • Today’s lecture: • Forest remote sensing • LECTURES • Jan 05 1. Intro • Jan 07 2. Images • Jan 12 3. Photointerpretation • Jan 14 4. Color theory • Jan 19 5. Radiative transfer • Jan 21 6. Atmospheric scattering • Jan 26 7. Lambert’s Law • Jan 28 8. Volume interactions • Feb 02 9. Spectroscopy • Feb 04 10. Satellites & Review • Feb 09 11. Midterm • Feb 11 12. Image processing • Feb 16 13. Spectral mixing • Feb 18 14. Classification • Feb 23 15. Radar & Lidar • Feb 25 16. Thermal infrared • Mar 02 17. Mars spectroscopy (Matt Smith) previous • Mar 04 18. Forest remote sensing (Van Kane) • Mar 09 19. Thermal modeling (Iryna Danilina) • Mar 11 20. Review • Mar 16 21. Final Exam
Today’s Topics • Physical measurements • Approaches • Problems • Spectral and LiDAR • Change detection
“It is, perhaps, time to draw the conclusion that current satellite sensors are not in general suitable for forestry planning since they contain little relevant information…” -- Holmgren and Thuresson (1998)
Did Someone Miss the Memo? • Remote Sensing of Environment • 1990: 5 papers on forest remote sensing (7%) • 2000: 32 papers (25%) • 2010: 89 papers (36%) • Understates trend – forest ecology papers using remote sensing increasingly common in mainstream ecological journals
What Are They Studying? • Research goals • Biomass (where’s the carbon?) • Wood volume (when can we take it to the bank?) • Presence (has something removed it?) • Productivity (how much biological activity?) • Fire mapping (where? how bad?) • Map habitat (where can critters live?) • Composition (what kinds of trees?) • Structure (what condition? how old?) • Map by • Space – where? • Time – change?
What is structure? Vertical and horizontal arrange of trees and canopy Why structure? Reflects growth, disturbance, maturation Surrogate for maturity, habitat, biomass… We’ll look at just two attributes Tree size (height or girth) Canopy surface roughness (rumple) ~ 50 years ~ 50 years ~ 125 years ~ 125 years ~ 300 years ~ 300 years Goal: Map Forest Structure Robert Van Pelt
Spectral Mixture Analysis Sabol et al. 2002 Roberts et al. 2004 Each pixel’s spectra dominated by a mixture of spectra from dominant material within pixel area
Endmember Images Original Landsat 5 image (Tiger Mountain S.F.) Shade (darker = more) Conifer (deciduous is ~ inverse for forested areas) Lighter = more NPV (lighter = more)
Physical Model Measure “rumple” • More structurally complex forests produce more shadow • We can model self-shadowing • Use self-shadowing to determine structure
Test Relationship Modeled self-shadowing Rumple Beer time! Kane et al. (2008)
Reality Check #!@^% Trees! Topography sucks Kane et al. (2008)
One Year Later… No beer… but Chapter 1 of dissertation
New Instrument - LiDAR Systems • Scanning laser emitter-receiver unit tied to GPS & inertial measurement unit (IMU) • Pulse footprint 20 – 40 cm diameter • Pulse density 0.5 – 30 pulses/m2 • 1 – 4 returns per pulse
Samples of LiDAR Data Point Cloud 400 x 10 ft 400 x 400 ft Canopy Surface Model Old-growth stand Cedar River Watershed
What LiDAR Measures • x, y, z coordinates of each significant reflection • Accuracies to ~10-15 cm • Height measurements • Max, mean, standard deviation, profiles • Measures significant reflections in vegetation structure not specific tree heights • Canopy density • Hits in canopy / all hits • Shape complexity • Canopy surface model • Intensity (brightness) of return • Near-IR wavelength typically used, photosynthetically active material are good reflectors
Physical Model Canopy density (# canopy hits/# all pulses) Height (95th percentile) Rumple (area canopy surface/area ground surface) Calculate for 30 m grid cells
Classify Sites by Using LiDAR Metrics • Statistically distinct classes • Distinct groupings of height, rumple, density values • Easy to associate classes with forest development • Class 8 old growth • Class 3 early closed canopy Beer time!
Reality Check • Older stands more likely in more complex classes and vice versa • But the variation! • Young and older forests in same classes • Wide range of classes within age ranges • Possible Explanations: • Multiple forest zones, presence or absence of disturbance, site productivity, conditions of initiation… #!@^% Trees!
Another Year Later… Still no beer, but had my dissertation and post-doc funding
Remotely Sensing Forest Attributes - 1 m spectral - 24 m hyperspectral - 30 m spectral - LiDAR From Lefsky et al. 2001 Match your question to the instrument best suited to answer it
Change Detection - Fire Severity Green Vegetation Burned Vegetation A B A B BGR Landsat TM B4 Landsat TM B7 Landsat TM B4 Landsat TM B7 (1984 – 2005) Landsat MSS B2 Landsat MSS B4 Landsat MSS B2 Landsat MSS B4 (1974 – 1983) van Wagtendonk et al. 2004
Differenced Normalized Burn Ratio Pre-fire Post-fire High severity Moderate severity Low severity No fire effect dNBR Key et al. 2002, Key and Benson 1999, 2002, 2004, 2005, van Wagtendonk 2004, Miller and Fites 2006, Miller 2007
Change Detection – Regional Monitoring LandTrendr Courtesy Robert Kennedy, OSU
Local Detection, Regional Monitoring Courtesy Robert Kennedy, OSU
Some Remote Sensing Thoughts • Remote sensing rarely gives answers • Remote sensing provides data that must be interpreted with intimate understanding of the target system • Interpretation is almost always local • Data must be tied to a physical model of the target system • The more directly the measurement is tied to the physical properties of the system, the easier it is to interpret and apply • In many ways harder than research that collects field data because you must be familiar with both the technical methods of remote sensing and intimately familiar with the target system • You’ll read twice as many papers at a minimum
But … • Remote sensing can open up avenues of research at scales impossible with field work alone