Download
1 / 14
150 likes | 315 Views
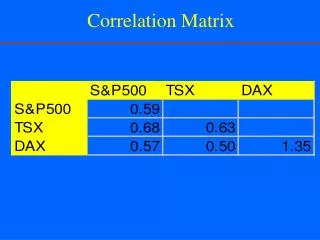
Creating, Understanding, and Reporting Your Correlation Matrix. MSU RStats Institute Workshop Chantal Levesque-Bristol, Ph.D. Correlation Matrix as Produced in SPSS. To produce in SPSS (see next slide) Analyze Correlate Bivariate Select variables of interest for analysis

E N D
Creating, Understanding, and Reporting Your Correlation Matrix MSU RStats Institute Workshop Chantal Levesque-Bristol, Ph.D.
Correlation Matrix as Produced in SPSS • To produce in SPSS (see next slide) • Analyze • Correlate • Bivariate • Select variables of interest for analysis • Examine correlation matrix in output (see next slide) • What do you notice?
Correlation Table Ready to Submit for Publication • Examine correlation table (see next slide) • Produced in word • No fancy borders
Correlation Table as Published in a Peer Reviewed Journal • Examine correlation table for published manuscript (see next slide) • Levesque & Brown (2007). Mindfulness as a moderator of the effect of implicit motivational self-concept on day-to-day behavioral motivation. Motivation and Emotion, 31, 284-299.
Beyond the Correlation Matrix • How to use the correlation matrix to build regressions models
Theorized Model To be tested with regressions Initial Model Built from correlations SP (pressure) SP (pressure) WB (well-being) WB (well-being) -.35** -.35** .50** .50** -.27** -.27** SATAQ (Interna-lization) SATAQ (Interna-lization)