Download
1 / 15
270 likes | 596 Views
Microsoft Excel. Used to organize information for calculations. Excel. Cells – intersection of a row and column. Columns – identified by letters. Starts with Column A through XFD. Rows – identified by numbers. There are 1,048,576 rows in one worksheet. Excel.

E N D
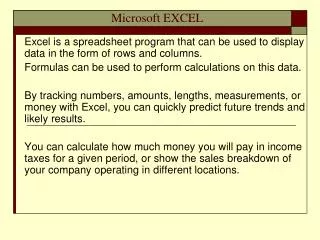
Microsoft Excel Used to organize information for calculations
Excel • Cells – intersection of a row and column. • Columns – identified by letters. Starts with Column A through XFD. • Rows – identified by numbers. There are 1,048,576 rows in one worksheet.
Excel • Cell Reference – identifies a worksheet cell by the column letter and row number (for example A1, B2 etc.) • Values – any number or formula. • Labels – any alphanumeric information.
Excel • Moving around the worksheet. • Move to the top of the worksheet = Ctrl + Home • Move to the last row of the worksheet = Ctrl + ↓ • Move to the last column of the worksheet = Ctrl + →. • Move to the last entry in the worksheet = Ctrl + End
Excel • Creating Formulas • Formulas – always begin a formula with the =(equal) sign and use mathematical operations -, +, *, /. • Functions – shortcut formulas • Can only use with adjacent cells which is called a range. • A range is always separated by a colon. • Example of a range is: A1:C5
Excel • Examples of functions are: =Sum - add a group of values = Average – find an average of a group of values =Max – find largest value in a group =Min – find the smallest value in a group =Count – tally a group of values =CountA – tally a group of labels
Excel • Formatting Numbers – how values are displayed. • Home tab, number section. • Centering Across a Selection • Select from Cell A1 to last column of keyed text in worksheet. • Home tab, alignment section, merge & center.
Excel • Creating a Header • Insert, Header or Footer • Key in Name and Date, click Path/filename from Header/Footer elements section. • Be sure your worksheet has been saved first.
Excel • To Wrap Text within a cell: • Select cell or cells • Home tab, alignment section, wrap text. • Fill Feature • Used to copy information from one cell to another • Point to lower right corner of cell until you see a black + sign. • Hold left mouse button and drag.
Excel • Adjust column Widths • Two Ways • Point to top of worksheet between columns and double click. -or – • Home tab, cell section, format. • To adjust entire worksheet columns. • Click above Row 1 (this selects entire worksheet) • Home tab, cell section, format, Autofit column width. • If you see ###### in a cell, value is too large for the width of the cell.
Excel • Inserting or Deleting Row or Columns. • Home tab, cell section, insert or delete • When inserting a row, all data moves down a row. • When inserting a column, all data moves right one column. • To insert multiple row or columns: • Select the number of row or columns you wish to insert first, then select insert.
Excel • Print a Worksheet. • Print two copies • One with totals and one with formulas. • Always Print Preview first • Check to be sure you have a header • Check to be sure worksheet fits on one page.
Excel • Printing a Worksheet (continued) • Display gridlines and row/column headings. • Page Layout tab, sheet options section, check off print for gridlines and headings. • Click Print Preview • Choose Page Setup, • Choose Fit to One Page. • Print a copy with totals displayed. • Display formulas • Press Ctrl + ~ (this symbol is above the tab key) • Click print preview (be sure worksheet fits on one page) • Print a copy with formulas displayed.
Excel • Applying Borders • Home tab, cells section, click on format, then format cells • Choose Border tab • Applying Shading and Patterns • Same as above. • Choose Fill tab
SORTING DATA • Select all data to be sorted • DO NOT INCLUDE COLUMN HEADINGS • Choose Home tab, Sort & Filter, • Click on Custom Sort • Choose: Column to be sorted. • Click “Add Level” for additional columns • Choose Order of Sort