Download
1 / 132
1.33k likes | 1.48k Views
WorkSafeBC Preliminary 2015 Base Premium Rates Injury Statistics and Trends. Accommodation, Ski Hills, Food & Beverage, Golf Courses, Casinos and Outdoor Sport Tour go2 Health & Safety Summit. August 21, 2014. Topics. WorkSafeBC’s mandate Overview of the preliminary 2015 rates

E N D
WorkSafeBCPreliminary 2015 Base Premium RatesInjury Statistics and Trends Accommodation, Ski Hills, Food & Beverage, Golf Courses, Casinos and Outdoor Sport Tour go2 Health & Safety Summit August 21, 2014
Topics • WorkSafeBC’s mandate • Overview of the preliminary 2015 rates • Industry Accident & Injury Stats and Trends • Resources • Questions
WorkSafeBC’s Mandate To work with workers and employers as follows: • To promote the prevention of workplace injury, illness, and disease • To rehabilitate those who are injured, and assist with timely return to work • To provide fair compensation to replace lost wages for injured workers during their recovery • To ensure sound financial management for a viable workers’ compensation system
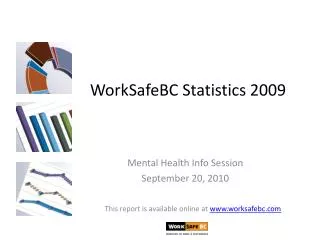
Overview of 2015 Rates The average base premium rate is projected to remain unchanged at $1.70 per $100 of employers’ assessable payroll. Increase in claims costs, Long Term Disability awards, and Health Care costs • Excess investment returns • $117 million withdrawal from the Capital Adequacy Reserve, and the capping of rate increases for industries at 20 percent have kept the average rate from increasing next year • 44 percent of employers will experience a base rate increase • 54 percent of employers will experience a base rate decrease • 2 percent of employers will have their base rate remain unchanged
Prepared by: Business Information and Analysis (BIA) CU 761056 (Short Term Overnight Accommodation) plus 761004, 761008, 761017, 761024, 761026, 761037, and 761055
In 2013, there were 1,902 employers in this industry, a 4% decrease over the past four years. The Injury Rate for the selected CUs remains lower than the Injury Rate for all BC CUs combined. The percentage of workers returning to work within 4 weeks increased in 2013 compared to 2012 and is lower than all BC (2013: 50% for Overnight and Short-term Accommodation vs. 52% for all BC). The average Short-Term Disability Duration (work days lost per claim) for the selected CUs is similar to all-BC. Light duty cleaners, food and beverage servers contribute the most claims in the selected CUs. Compared to 2012, the number of Prevention Orders issued to employers in the selected CUs decreased by 1% to 295 orders in 2013. As of June 30, 2014, 114 Prevention Orders have been issued year-to-date. Between 2009 and 2014 YTD, there were 6 work-related deaths. Key Findings Prepared by Business Information & Analysis, WorkSafeBC
Statistical Overview Prepared by Business Information & Analysis, WorkSafeBC
Injury Rate Trend Prepared by Business Information & Analysis, WorkSafeBC
Claims and Employment Trends Prepared by Business Information & Analysis, WorkSafeBC
STD Duration – Five Year Trend Prepared by Business Information & Analysis, WorkSafeBC
Return to Work (RTW) Prepared by Business Information & Analysis, WorkSafeBC
Occupations (Top 10) Prepared by Business Information & Analysis, WorkSafeBC
Young Workers (aged 15-24) represent 13%, while MatureWorkers (aged 45 - 64) represent 46% of the total STD/LTD/Fatal claims. The majority of these claims were made by females. Age and Gender Prepared by Business Information & Analysis, WorkSafeBC
Accident and Injury Type * Note: Uncoded claim costs have been proportionally allocated to coded categories. Prepared by Business Information & Analysis, WorkSafeBC
Other Injury Factors * Note: Uncoded claim costs have been proportionally allocated to coded categories. Prepared by Business Information & Analysis, WorkSafeBC
Serious Injury Claims *Serious Injuries include time-loss claims that represent either a serious medical diagnosis, or a potentially-serious medical diagnosis with a long recovery period of 50+ days paid (10+ weeks off work). Serious Injuries also include all work-related death claims. Prepared by Business Information & Analysis, WorkSafeBC
Fall on Same Level Cost Days • $ 120,486 $ 160,164 209 Fall from Elevation Cost Days $ 45,405 Walking down the stairwell tripped and fell backwards. $ 16,000 110 Serious Injury Claim Examples Prepared by Business Information & Analysis, WorkSafeBC
Work-Related Deaths Prepared by Business Information & Analysis, WorkSafeBC
Prevention Activity Prepared by Business Information & Analysis, WorkSafeBC
Prevention Orders Prepared by Business Information & Analysis, WorkSafeBC
Penalties & Warning Letters Prepared by Business Information & Analysis, WorkSafeBC
In 2013, there were 8,048 employers in this industry, a 5% increase over the past four years. The Injury Rate for the Restaurant or Other Dining Establishment CU remains lower than the Injury Rate for all BC CUs combined. The percentage of workers returning to work within 4 weeks decreased in 2013 compared to 2012 and is higher than all BC (2013: 67% for Restaurant or Other Dining Establishment vs. 52% for all BC). The average Short-Term Disability Duration (work days lost per claim) for the Restaurant or Other Dining Establishment CU is significantly lower than all BC. Food counter attendants, kitchen helpers and related support occupations, cooks contribute the most claims in the Restaurant or Other Dining Establishment CU. Compared to 2012, the number of Prevention Orders issued to employers in Restaurant or Other Dining Establishment decreased by 2% to 465 orders in 2013. As of June 30, 2014, 200 Prevention Orders have been issued year-to-date. Between 2009 and 2014 YTD, there were 5 work-related deaths. Key Findings Prepared by Business Information & Analysis, WorkSafeBC
Statistical Overview Prepared by Business Information & Analysis, WorkSafeBC
Injury Rate Trend Prepared by Business Information & Analysis, WorkSafeBC
The estimated number of workers (Person Years) saw a slight increase in 2013, whereas the number of time-loss claims decreased by 8%. This has resulted in a decrease in the Injury Rate for the Restaurant or Other Dining Establishment CU in 2013. Claims and Employment Trends Prepared by Business Information & Analysis, WorkSafeBC
STD Duration – Five Year Trend Prepared by Business Information & Analysis, WorkSafeBC
Return to Work (RTW) Prepared by Business Information & Analysis, WorkSafeBC
Occupation Type # of Claims % of Claims Food counter attendants, kitchen helpers and related support occupations 3,815 33% Cooks 3,566 31% Food and beverage servers 1,286 11% Restaurant and food service managers 603 5% Chefs 429 4% Food service supervisors 276 2% Cashiers 275 2% Bakers 223 2% Bartenders 217 2% Maitres d'hotel and hosts/hostesses 136 1% Other 631 6% Grand Total 11,457 100% Occupations (Top 10) Prepared by Business Information & Analysis, WorkSafeBC
Young Workers (aged 15-24) represent 35%, while Mature Workers (aged 45 - 64) represent 26% of the total STD/LTD/Fatal claims. The majority of these claims were made by females. Age and Gender Prepared by Business Information & Analysis, WorkSafeBC
Accident and Injury Type * Note: Uncoded claim costs have been proportionally allocated to coded categories. Prepared by Business Information & Analysis, WorkSafeBC
Other Injury Factors * Note: Uncoded claim costs have been proportionally allocated to coded categories. Prepared by Business Information & Analysis, WorkSafeBC
Serious Injury Claims *Serious Injuries include time-loss claims that represent either a serious medical diagnosis, or a potentially-serious medical diagnosis with a long recovery period of 50+ days paid (10+ weeks off work). Serious Injuries also include all work-related death claims. Prepared by Business Information & Analysis, WorkSafeBC
Struck By Cost Days $ Worker was moving a cart of dishes into elevator, as the cart went over the gap between the floor $ 28,000 170 & elevator, a plate fell off cart hitting worker on finger. Serious Injury Claim Examples Prepared by Business Information & Analysis, WorkSafeBC
Work-Related Deaths Prepared by Business Information & Analysis, WorkSafeBC
Prevention Activity Prepared by Business Information & Analysis, WorkSafeBC
Prevention Orders Prepared by Business Information & Analysis, WorkSafeBC
Penalties & Warning Letters Prepared by Business Information & Analysis, WorkSafeBC
In 2013, there were 767 employers in this industry, a 6% decrease over the past four years. The Injury Rate for the Pub, Bar, Night Club, or Lounge CU remains lower than the Injury Rate for all BC CUs combined. The percentage of workers returning to work within 4 weeks decreased in 2013 compared to 2012 and is higher than all BC (2013: 63% for Pub, Bar, Night Club, or Lounge vs. 52% for all BC). The average Short-Term Disability Duration (work days lost per claim) for the Pub, Bar, Night Club, or Lounge CU is significantly lower than all BC. Cooks, food and beverage servers contribute the most claims in the Pub, Bar, Night Club, or Lounge CU. Compared to 2012, the number of Prevention Orders issued to employers in Pub, Bar, Night Club, or Lounge increased by 5% to 91 orders in 2013. As of June 30, 2014, 19 Prevention Orders have been issued year-to-date. Between 2009 and 2014 YTD, there were no work-related deaths. Key Findings Prepared by Business Information & Analysis, WorkSafeBC
Statistical Overview Prepared by Business Information & Analysis, WorkSafeBC
Injury Rate Trend Prepared by Business Information & Analysis, WorkSafeBC
Claims and Employment Trends Prepared by Business Information & Analysis, WorkSafeBC
STD Duration – Five Year Trend Prepared by Business Information & Analysis, WorkSafeBC
Return to Work (RTW) Prepared by Business Information & Analysis, WorkSafeBC
Occupations (Top 10) Prepared by Business Information & Analysis, WorkSafeBC
Young Workers (aged 15-24) represent 32%, while Mature Workers (aged 45 – 64) represent 18% of the total STD/LTD/Fatal claims. The slight majority of these claims were made by males. Age and Gender Prepared by Business Information & Analysis, WorkSafeBC