Download
1 / 38
390 likes | 516 Views
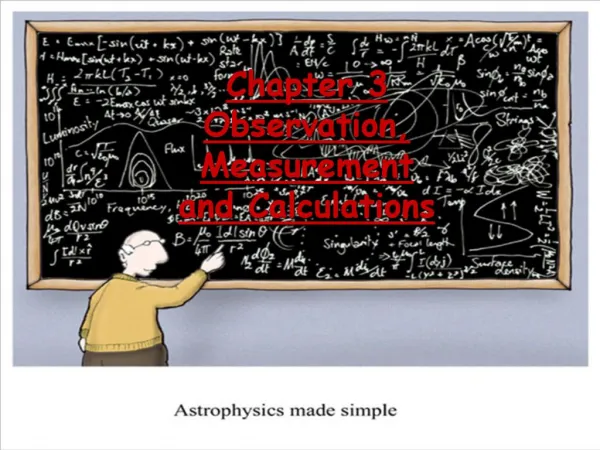
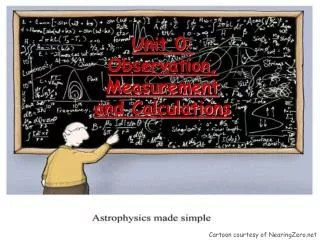
Observation, Measurement and Calculations. Cartoon courtesy of NearingZero.net. Steps in the Scientific Method. 1. Observations - quantitative - qualitative 2. Formulating hypotheses - possible explanation for the observation 3. Performing experiments

E N D
Observation,Measurementand Calculations Cartoon courtesy of NearingZero.net
Steps in the Scientific Method • 1. Observations • - quantitative • - qualitative • 2. Formulating hypotheses • - possible explanation for the observation • 3. Performing experiments • - gathering new information to decide whether the hypothesis is valid
Outcomes Over the Long-Term • Theory (Model) • - A set of tested hypotheses that give an overall explanation of some natural phenomenon. • Natural Law • - The same observation applies to many different systems • - Example - Law of Conservation of Mass
Law vs. Theory • A law summarizes what happens • A theory (model) is an attempt to explain why it happens.
Nature of Measurement Measurement - quantitative observation consisting of 2 parts • Part 1 - number • Part 2 - scale (unit) • Examples: • 20grams • 6.63 x 10⁻³⁴Joule seconds
Systems of measurement • Metric system vs English system • Metric (SI) International system • Standardized -international • consistent base units • multiples of 10 • English (US) system • non-standard -only US • no consistent base units • no consistent multiples
Using the Metric system • Prefixes for multiples of 10 • T - G - M -k h d (base) d c m - - - - n - -p • Tera 1012 – Giga 109 – Mega 106 – kilo 103 – hecto 102 – deka 10 1 – base – deci 10-1 – centi 10 –2 - milli 10 –3 – micro 10 –6 –nano 10 –9 – pico 10 -12 • move the decimal to convert
Moving the decimal For measurements that are defined by a single unit such as length, mass, or liquid volume and later in the course, power, current, voltage, etc., simply move the decimal the number of places indicated by the prefix. 400 m = ? cm 400 m = ? cm 40,000 cm 75 mg = ? g 7 5 mg = ? g 0.075 g 0.025 m = ? mm 0.000025 mm
Converting measurements • Metric Metric • multiples of 10 • move decimal • *area - move twice • *volume - move three times • English Metric • conversion factors • proportion method • unit cancellation method
Common Conversions1 kilometer = .621 miles1 meter = 39.4 inches1 centimeter = .394 inches1 kilogram = 2.2 pounds1 gram = .0353 ounce1 liter = 1.06 quarts
Uncertainty in Measurement • A digit that must be estimated is called uncertain. A measurement always has some degree of uncertainty.
Why Is there Uncertainty? • Measurements are performed with instruments • No instrument can read to an infinite number of decimal places
Precision and Accuracy • Accuracyrefers to the agreement of a particular value with the truevalue. • Precisionrefers to the degree of agreement among several measurements made in the same manner. Neither accurate nor precise Precise but not accurate Precise AND accurate
Rules for Counting Significant Figures • Nonzero integersalways count as significant figures. • 3456has • 4sig figs.
Rules for Counting Significant Figures • Zeros • -Captive zeros always count as significant figures.(zeros in between nonzeros) • 16.07 has • 4 sig figs.
Rules for Counting Significant Figures • Zeros • -Leading zeros do not count as significant figures. • 0.0486 has • 3 sig figs.
Rules for Counting Significant Figures • Zeros • Trailing zerosare significant only if the number contains a decimal point. • 9.300 has • 4 sig figs.
Rules for Counting Significant Figures • Any whole number that ends in zero and does not have a decimal in unclear or unknown. • 10 unknown • 20. Has 2 significant figures
Sig Fig Practice #1 0 How many significant figures in each of the following? 1.0070 m 5 sig figs 17.10 kg 4 sig figs 100,890 L unclear 3.29 x 10³ s 3 sig figs 0.0054 cm 2 sig figs 3,200,000 unclear
Rules for Significant Figures in Mathematical Operations • Multiplication and Division:# sig figs in the result equals the number with the least number of sig figs. • 6.38 x 2.0 = • 12.76 13 (2 sig figs)
Sig Fig Practice #2 0 Calculation Calculator says: Answer 22.68 m2 3.24 m x 7.0 m 23 m2 100.0 g ÷ 23.7 cm3 4.22 g/cm3 4.219409283 g/cm3 0.02 cm x 2.371 cm 0.05 cm2 0.04742 cm2 710 m ÷ 3.0 s 236.6666667 m/s unclear 5.87 x 10³ lb·ft 1818.2 lb x 3.23 ft 5872.786 lb·ft 2.9561 g/mL 2.96 g/mL 1.030 g ÷ 2.87 mL
Rules for Significant Figures in Mathematical Operations 0 • Addition and Subtraction: The number of decimal places in the result equals the number of decimal places in the number with the least decimal places. • 6.8 + 11.934 = • 18.734 18.7 (3 sig figs)
Sig Fig Practice #3 Calculation Calculator says: Answer 10.24 m 3.24 m + 7.0 m 10.2 m 100.0 g - 23.73 g 76.3 g 76.27 g 0.02 cm + 2.371 cm 2.39 cm 2.391 cm 713.1 L - 3.872 L 709.228 L 709.2 L 1821.6 lb 1818.2 lb + 3.37 lb 1821.57 lb 0.160 mL 0.16 mL 2.030 mL - 1.870 mL
Significant Figures 0 • Rules for rounding off numbers • (1) If the digit to be dropped is greater than 5, the last retained digit is increased by one. For example, • 12.6 is rounded to 13. • (2) If the digit to be dropped is less than 5, the last remaining digit is left as it is. For example, • 12.4 is rounded to 12.
0 (3) If the digit to be dropped is 5, and if any digit following it is not zero, the last remaining digit is increased by one. For example, 12.51 is rounded to 13
Significant Figures 0 • (4) If the digit to be dropped is 5 and is followed only by zeros, the last remaining digit is increased by one if it is odd, but left as it is if even. For example,
11.5 is rounded to 12, 12.5 is rounded to 12. This rule means that if the digit to be dropped is 5 followed only by zeros, the result is always rounded to the even digit. The rationale is to avoid bias in rounding: half of the time we round up, half the time we round down. 0
Scientific Notation In science, we deal with some very LARGE numbers: 1 mole = 602000000000000000000000 In science, we deal with some very SMALL numbers: Mass of an electron = 0.000000000000000000000000000000091 kg
Imagine the difficulty of calculating the mass of 1 mole of electrons! 0.000000000000000000000000000000091 kg x 602000000000000000000000 ???????????????????????????????????
Scientific Notation: A method of representing very large or very small numbers in the form: M x 10n • M is a number between 1 and 10 • n is an integer
. 2 500 000 000 9 7 6 5 4 3 2 1 8 Step #1: Insert an understood decimal point Step #2: Decide where the decimal must end up so that one number is to its left Step #3: Count how many places you bounce the decimal point Step #4: Re-write in the form M x 10n
2.5 x 10⁹ The exponent is the number of places we moved the decimal.
0.0000579 1 2 3 4 5 Step #2: Decide where the decimal must end up so that one number is to its left Step #3: Count how many places you bounce the decimal point Step #4: Re-write in the form M x 10n
5.79 x 10⁻⁵ The exponent is negative because the number we started with was less than 1.
Direct Proportions • The quotient of two variables is a constant • As the value of one variable increases, the other must also increase • As the value of one variable decreases, the other must also decrease • The graph of a direct proportion is a straight line
Inverse Proportions • The product of two variables is a constant • As the value of one variable increases, the other must decrease • As the value of one variable decreases, the other must increase • The graph of an inverse proportion is a hyperbola