Download
1 / 30
300 likes | 420 Views
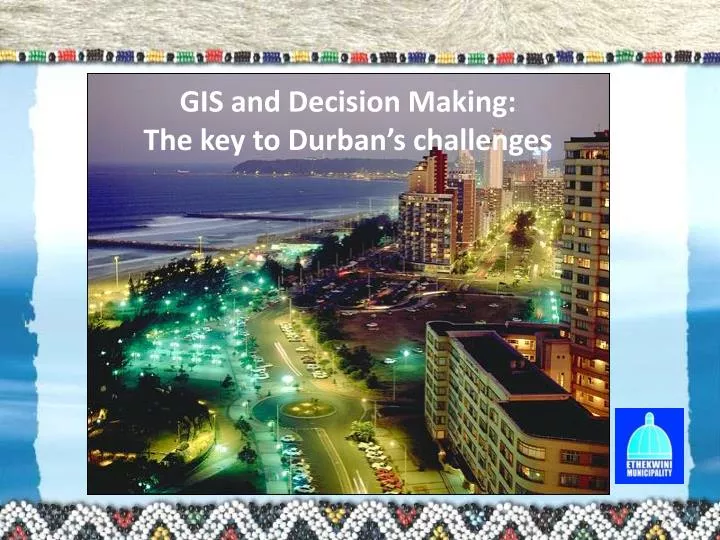
GIS and Decision Making: The key to Durban’s challenges. EThekwini Municipality. 2297 square kilometers Population : ~ 3 50 0 000 House holds: ~ 800 000 Informal Dwellings: ~ 235 000 Formal Households: ~ 600 000 Employees: ~ 18 0 00 W atermains : ~ 11354.367 km

E N D
EThekwini Municipality 2297 square kilometers Population: ~ 3 500000 House holds: ~ 800 000 Informal Dwellings: ~ 235 000 Formal Households: ~ 600 000 Employees: ~ 18 000 Watermains: ~ 11354.367 km 11175.646 km street network Internal and external customers Desktop and web GIS environments ~125 GIS data sets
The question is: Is the GIS used to help make decisions, or is it used to justify decisions made for many other reasons? Easy access to information
"Knowing where things are and why it is there, is essential to rational decision making" Geographic Information System
Our GIS Strategy • To make best use of information and communications technology to support integrated systems and sharing of municipal information • To ensure appropriate organisational infrastructure to support the vision and objectives of our IDP and ICT strategy • To ensure that interested and affected individuals and our Service Centers have the information they require to enable them to make informed decisions • To ensure that appropriate information to underpin decisions for improving provision of our services is available.
Our Uses of a GIS • A Management tool in all aspects of infrastructure management • Planning and Monitoring • Avisualisation tool for improved identification • Environment of seamless, paperless interaction between departments • Improved property information management and analyses • Improved efficiency as data is made centrally available via an integrated GIS infrastructure Improved business processes and better decision making
Our Central Hub Corporate GIS Directs our corporate Geographic Information Systems policy and provide spatial information and support to all users within eThekwini Municipal area in order to facilitate informed decision making and enable users to achieve their objectives
Existing Scheme ‘District’ Map
Zoning Land Use
Knowing Our Consumers Formal Settlements Informal Settlements
ETHEKWINI MUNICIPALITY APPROVED SPATIAL DEVELOPMENT PLANS 2011 GIS METHODOLOGY Income Levels 1:15000 A0 maps with the MrSid Images (Aerial Photography), Cadastral, Future Residential Income, Informal Settlements and the 5 Year Housing Projects were plotted for the Framework Planning Staff to use to identify proposed housing developments in the North Spatial Development Plan. The Future Residential Income shapefile was copied and renamed to Future Residential Income Levels. A field called Income Level and Name was added to the attribute table. Planning Units The Planning Units in the North Spatial Development Plan identified by the Framework Planning Staff were classified as Low, Low to Medium, Medium and High (R. Dyer, email dated 7 May 2008). These income levels were added to the attribute table. Informal Settlements and 5 Year Housing Projects Proposed residential developments was digitized in the Future Residential Income Levels, using the Informal Settlements and the 5 Year Housing Projects as a base layer in the North Spatial Development Plan identified by the Framework Planning Staff were classified as Low, Low to Medium, Medium, Medium and High (R. Dyer, email dated 7 May 2008). AGRICULTURE Fazal Ebrahim used the Bioresource Research Program to identify agriculture areas for the SDP's in 2009. Fazal Ebrahim, A Nansook, A. Zungu, F. Ngcobo and K. Singh met with Dept of Agriculture, Brent Forbes in February 2009 at Cedara and Brent Forbes confirmed that the SDP Agriculture areas aligns with Dept of Agriculture. The SDP data and documents were hand delivered to the various provincial departments in October 2009. No comments were received. Fazal obtained an updated version of the BRU in 2010. Piers Whitwell confirmed that no changes were made to the data. In February 2011 second set of SDP data and documents was given to the various Provincial Depts. No comments.
ETHEKWINI MUNICIPALITY SPATIAL DEVELOPMENT PLANS 2011 SDP LAND USE CATEGORIES INCOME INCOME LEVEL LOW R 120 000.00 LOW TO MEDIUM R 120 000.00 – R 450 000.00 MEDIUM R 450 000.00 – R 1 000 000.00 MEDIUM TO HIGH R 1 000 000.00 – R 2 000 000.00
ETHEKWINI MUNICIPALITY SPATIAL DEVELOPMENT PLANS 2011 SDP LAND USE CATEGORIES
ETHEKWINI MUNICIPALITY SPATIAL DEVELOPMENT PLANS 2011 SDP LAND USE CATEGORIES
ETHEKWINI MUNICIPALITY APPROVED SPATIAL DEVELOPMENT PLANS 2011 North SDP South SDP
ETHEKWINI MUNICIPALITY SPATIAL DEVELOPMENT FRAMEWORK 2012
ETHEKWINI MUNICIPALITY APPROVED SPATIAL DEVELOPMENT PLANS 2011 North South SDP Central SDP
ETHEKWINI MUNICIPALITY SPATIAL DEVELOPMENT FRAMEWORK 2012
Electricity Electricity Network
Conclusions • Today’s decision needs to be information driven • Our systems and tools needs to contribute towards fulfilling the objectives of the IDPs • Geographic information should be the bases for monitoring, evaluation systems and performance management
The eThekwini Municipality Thanks You!!www.durban.gov.za 19 September 2012