Download
1 / 6
60 likes | 227 Views
Topic #6 – graphing . Basic graphing options 1. Generic functions 2. Special graphs 3. Graphing layout. Topic #6 – graphing . Basic graphing options 3. Graphing layout. Topic #6 – graphing . Basic graphing options 1. Generic functions a. Flexible plot

E N D
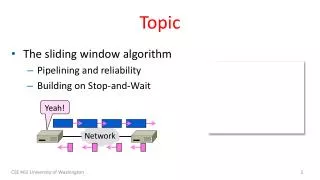
Topic #6 – graphing Basic graphing options 1. Generic functions 2. Special graphs 3. Graphing layout
Topic #6 – graphing Basic graphing options 3. Graphing layout
Topic #6 – graphing Basic graphing options 1. Generic functions a. Flexible plot plot.type is “p” for points and “l” for lines b. Add points to existing plot c. Add lines to existing plot plot(y= , x= , type=plot.type ...) points(y= , x= , ...) lines(y= , x= , ...)
Topic #6 – graphing • Basic graphing options • 2. Special graphs • a. Histograms • b. Density functions • Used to show the distribution of empirical estimates • c. Cumulative distribution functions • Used to the percent that exceeds a given value hist(...) plot(density(Vector)) plot(ecdf(Vector))
Topic #6 – graphing • Basic graphing options • 3. Graphing layout • Step #1 – Split graphing screen • Include matrix declaring number of rows and columns • Step #2 – Specify frame to use • Tells which panel to use next • Step #3 – When done, close all screens • Tells R not to use split.screen anymore split.screen(c(2,2)) screen(1) close.screen(all=TRUE)
Topic #6 – graphing Saving a graph [click on graph page] > file > save as > jpeg > 100% quality