Download
1 / 17
170 likes | 314 Views
7.3 – Graphs of Functions 7.4 – Algebras of Functions. Equations of Lines Standard form: Ax + By = C Slope-intercept form: y = mx + b Point-slope form: y y 1 = m ( x x 1 ). y -intercept (0, 5). x -intercept (2, 0). 5 x + 2 y = 10. Example.

E N D
Equations of Lines Standard form: Ax + By = C Slope-intercept form: y = mx + b Point-slope form: y y1 = m(x x1)
y-intercept (0, 5) x-intercept (2, 0) 5x + 2y = 10 Example Graph 5x + 2y = 10. Solution Let x = 0 to find the y-intercept: 5 • 0 + 2y = 10 2y = 10 y = 5 The y-intercept is (0, 5). Let y = 0 to find the x-intercept: 5x + 2• 0 = 10 5x = 10 x = 2 The x-intercept is (2, 0).
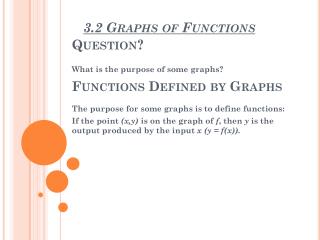
Graph: 3x + 4y = 12 Example Solution Rewrite the equation in slope-intercept form.
left 4 (4, 6) up 3 (0, 3) down 3 right 4 (4, 0) Solution The slope is 3/4 and the y-intercept is (0, 3). We plot (0, 3), then move down 3 units and to the right 4 units. An alternate approach would be to move up 3 units and to the left 4 units.
Linear Function A function described by an equation of the form f(x) = mx + b is a linear function. Its graph is a straight line with slope m and y-intercept at (0, b). When m = 0, the function is described by f(x) = b is called a constant function. Its graph is a horizontal line through (0, b).
right 3 (3, 2) up 4 units (0, 2) down 4 (3, 6) left 3 Graph: Example Solution The slope is 4/3 and the y-intercept is (0, 2). We plot (0, 2), then move up 4 units and to the right 3 units. We could also move down 4 units and to the left 3 units. Then draw the line.
y = 2 (0, 2) (4, 2) (4, 2) Graph y = 2 Example Solution This is a constant function. For every input x, the output is 2. The graph is a horizontal line.
Nonlinear Functions • A function for which the graph is not a straight line is a nonlinear function.
Example Graph the function given by g(x) = |x + 2|. Solution Calculate function values for several choices of x and list the results in a table.
The Algebra of Functions If f and g are functions and x is in the domain of both functions, then:
Example For find the following. a) ( f + g)(4) b) ( f – g)(x) c) ( f /g)(x) d) Solution a) Since f (4) = –8 and g(4) = 13, we have ( f + g)(4) = f (4) + g(4) = –8 + 13 = 5.
c) We have, d) Since f (–1) = –3 and g(–1) = –2, we have Solution b) We have,
Solution Domain of f + g, f – g, and Example find the domains of
Thus the domain of f /g is Solution continued To find the domain of f /g, note that can not be evaluated if x + 1 = 0 or x – 2 = 0.
Examples • Find the following • (f+g)(x) b. (f – g)(x) c. (fg)(x) d. (f/g)(0) • Evaluate when f(x) = x² + 1 and g(x) = x - 4
Group Exercise For the functions • (f+g)(x) • (f – g)(x) • (fg)(x) • (f/g)(0) • (f+g)(-1) • (fg)(0) • (f/g)(1)