Download
1 / 130
1.3k likes | 1.31k Views
Performance of Nordic Countries in TIMSS and PIRLS: An Asian perspective. Frederick K.S. Leung The University of Hong Kong A presentation delivered at the conference “Northern Lights on TIMSS and PIRLS 2011 19 May 2014. Countries in TIMSS and PIRLS 2011. Armenia Australia Austria

E N D
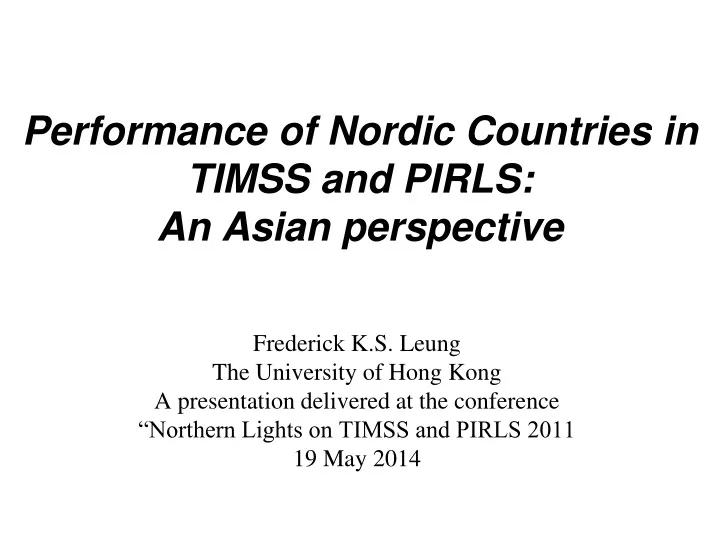
Performance of Nordic Countries in TIMSS and PIRLS:An Asian perspective Frederick K.S. Leung The University of Hong Kong A presentation delivered at the conference “Northern Lights on TIMSS and PIRLS 2011 19 May 2014
Countries in TIMSS and PIRLS 2011 Armenia Australia Austria Azerbaijan Bahrain Belgium (Flemish) Botswana Chile Chinese Taipei Croatia Czech Republic Denmark England Finland Georgia Germany Ghana Honduras Hong Kong SAR Hungary Indonesia Iran, Islamic Rep. of Ireland Israel Italy Japan Jordan Kazakhstan Korea, Rep. of Kuwait Lebanon Lithuania Macedonia Malaysia Malta Morocco The Netherlands New Zealand Northern Ireland Norway Oman Palestinian Nat’l Auth. Poland Portugal Qatar Romania Russian Federation Saudi Arabia Serbia Singapore Slovak Republic Slovenia South Africa Spain Sweden Syrian Arab Republic Thailand Tunisia Turkey Ukraine United Arab Emirates United States Yemen
Trends in International Mathematics and Science Study (TIMSS) 2011 4th Grade Mathematics
Trends in International Mathematics and Science Study (TIMSS) 2011 4th Grade Mathematics (first 15 countries)
Trends in International Mathematics and Science Study (TIMSS) 2011 8th Grade Mathematics
Trends in International Mathematics and Science Study (TIMSS) 2011 8th Grade Mathematics (first 15 countries)
Trends in International Mathematics and Science Study (TIMSS) 2011 4th Grade Science
Trends in International Mathematics and Science Study (TIMSS) 2011 4th Grade Science (first 15 countries)
Trends in International Mathematics and Science Study (TIMSS) 2011 8th Grade Science
Trends in International Mathematics and Science Study (TIMSS) 2011 8th Grade Science (first 15 countries)
Performance of East Asian and Nordic countries in TIMSS & PIRLS 2011 Maths G4 S’pore (606) Korea (605) HKG (602) Taiwan (591) Japan (585 Finland (545) Denmark (537) Sweden (504) Norway (495) Maths G8 Korea (613) S’pore (611) Taiwan (609) HKG (586) Japan (570) Finland (514) Sweden (484) Norway (475) Science G4 Korea (587) S’pore (583) Finland (570) Japan (559) Taiwan (552) HKG (535) Sweden (533) Denmark (528) Norway (494) Science G8 S’pore (590) Taiwan (564) Korea (560) Japan (558) Finland (552) HKG (535) Sweden (509) Norway (494) Reading G4 HKG (571) Finland (568) S’pore (567) Denmark (554) Taiwan (553) Sweden (542) Norway (507) Mathematics achievements of East Asian countries in past cycles of TIMSS
Trends in International Mathematics and Science Study (TIMSS) 2007
Trends in International Mathematics and Science Study (TIMSS) 2007
How do we explain such patterns of scores? Can the patterns of student achievements be explained by background variables such as the wealth of the countries or the characteristics of the education systems?
Trends in International Mathematics and Science Study (TIMSS) 2011 GNI per capita (US$)
Background variables for East Asian countries in TIMSS 2007 (Mathematics) • Parent with University Degree or Above • Mathematics Teacher with University Degree or Above • Class size for Mathematics Instruction • Mathematics Instructional Time • Emphasis on Mathematics Homework • School Resources for Mathematics Instruction
Trends in International Mathematics and Science Study (TIMSS) 2007 Parent with University Degree or Above (Int’l Avg. = 24%)
Trends in International Mathematics and Science Study (TIMSS) 2007 Mathematics Teacher with University Degree or Above (G.4 Int’l Avg. = 70%)
Trends in International Mathematics and Science Study (TIMSS) 2007 Mathematics Teacher with University Degree or Above (G.8 Int’l Avg. = 78%)
Trends in International Mathematics and Science Study (TIMSS) 2007 Class size for Mathematics Instruction (G.4 Int’l Avg. = 26 students)
Trends in International Mathematics and Science Study (TIMSS) 2007 Class size for Mathematics Instruction (G.8 Int’l Avg. = 29 students)
Trends in International Mathematics and Science Study (TIMSS) 2007 Mathematics Instructional Time (G.4 Int’l Avg. = 144 hours)
Trends in International Mathematics and Science Study (TIMSS) 2007 Mathematics Instructional Time (G.8 Int’l Avg. = 120 hours)
Trends in International Mathematics and Science Study (TIMSS) 2007 Percentage of Implemented Instructional Time for Mathematics (G.4 Int’l Avg. = 16%)
Trends in International Mathematics and Science Study (TIMSS) 2007 Percentage of Implemented Instructional Time for Mathematics (G.8 Int’l Avg. = 12%)
Trends in International Mathematics and Science Study (TIMSS) 2007 High Emphasis on Mathematics Homework(G.4 Int’l Avg. = 13%)
Trends in International Mathematics and Science Study (TIMSS) 2007 High Emphasis on Mathematics Homework (G.8 Int’l Avg. = 28%)
Trends in International Mathematics and Science Study (TIMSS) 2007 School Resources for Mathematics Instruction (G.4 Int’l Avg. = 43%)
Trends in International Mathematics and Science Study (TIMSS) 2007 School Resources for Mathematics Instruction (G.8 Int’l Avg. = 32%)
Background variables related to high mathematics achievement of East Asian countries in TIMSS 2007 • Class size • Larger class size • Grade 4 homework • More emphasis on mathematics homework at Grade 4
What can we conclude? • Student achievement cannot be accounted for totally, or even to a significant extent, by these background factors • Some factors (e.g., SES) may explain variations in achievement within a country, but they may not account for across country differences • Background characteristics may be important factors for explaining student achievement, but they are not the only factors – and may not even be the most important factors
How do we explain student achievements?The IEA Curriculum framework:
Does the implemented curriculum explain the attained curriculum? TIMSS 1999 Video Study Goal: To describe and compare eighth-grade mathematics teaching across seven countries (Australia, Czech Republic, Hong Kong SAR, Japan*, Netherlands, Switzerland, United States) * The 1995 Japanese data were re-analyzed using the 1999 methodology in some of the analysis
Sampling and Data Collection of the TIMSS 1999 Video Study • National probability sample of 8th-grade mathematics lessons: aVideo Survey • One lesson per teacher • Sampled across the school year • Standardized camera procedures • Altogether 638 lessons were videotaped from 50 (Japan) – 140 (Switzerland)
Analysing the TIMSS 1999 videos: • Quantitative analysis • Structure of the lessons • Events in the lessons • Mathematics problems worked on in the lessons • Qualitative analysis • Expert judgement on the quality of the lessons
Data coding and analysis • An international team developed codes to apply to the video data. • Fluently bilingual coders in the international video coding team applied 45 codes in seven coding passes to each of the videotaped lessons. • Three marks (i.e., the in-point, out-point, and category) were evaluated and included in the measures of reliability. • If, after numerous attempts, reliability measures fell below the minimum acceptable standard, the code was dropped from the study.
The Mathematics Quality Analysis Group • A specialist group in mathematics and teaching mathematics at the post-secondary level reviewed a randomly selected subset of 120 lessons (20 lessons from each country except Japan). • The international video coding team created expanded lesson tables for each lesson in this subset. • The tables included details about the classroom interaction, the nature of the math problems worked on, mathematical generalizations, and other relevant information. • The tables were “country-blind,” with all indicators that might reveal the country removed.
Do instructional practices explain the high student achievement? Instructional practices in Hong Kong: 1. Whole-class interaction dominates “Comparing across countries, eighth-grade mathematics lessons in Hong Kong SAR spent a greater percentage of lesson time in public interaction (75 percent) than those in the other countries, except the United States.” (pp. 54-55, Chapter 3)
Lesson Organization: Percent of lesson time in different interaction types # Rounds to zero. ‡ Reporting standards not met. Too few cases to be reported.
2. Teacher talks most of the time “Hong Kong SAR eighth-grade mathematics teachers spoke significantly more words relative to their students (16:1) than did teachers in Australia (9:1), the Czech Republic (9:1), and the United States (8:1).” (p. 109, Chapter 5)
Average number of teacher and student words per lesson (50 minutes)