Download
1 / 36
360 likes | 557 Views
Introduction to Excel Pivot Tables. Pre-Requisites. Basic knowledge using Excel 2010. STC Workshops. Access workshop information and materials at: http:// www.csus.edu/irt/STC/workshops/index.html. Connect to our Social Spaces. facebook.com/ sacstateIRT twitter.com/ sacstateIRT

E N D
Pre-Requisites • Basic knowledge using Excel 2010
STC Workshops • Access workshop information and materials at: http://www.csus.edu/irt/STC/workshops/index.html
Connect to our Social Spaces facebook.com/sacstateIRT twitter.com/sacstateIRT youtube.com/sacstateIRT instagram.com/sacstateIRT
Objectives • Learn how to create pivot table reports, • Learn how to use SparkLines, • Learn how to save and print reports.
Backup Your Data • Back up Raw data by creating a copy • Work from worksheet copy of raw data • Copy ensures raw data is not lost if something goes wrong • Move raw data copy to be first sheet Demonstration + Activity: Open sample excel file and make a copy of worksheet into existing workbook
Rename worksheets • Helps keep track of worksheet contents • Limit of 31 Characters • Worksheet with Raw data should contain “Raw data” reference Demonstration + Activity: Rename the original Raw data worksheet and worksheet copy
Remove duplicates • Find duplicate data with conditional formatting • Filter for Unique Values • Use Remove Duplicates Command
Demo & Activity • Use Conditional Formatting, Remove duplicates, options • Clear rules from selected sheets when you remove duplicates • Home > Styles > conditional formatting > clear rules from entire sheet
Convert Data to Table • Enables data to be more usable • Apply a Table Style and other formatting • Sort and Filter options enabled automatically in table view • Generate a Pivot Table from existing table Demonstration + Activity Convert data into a table
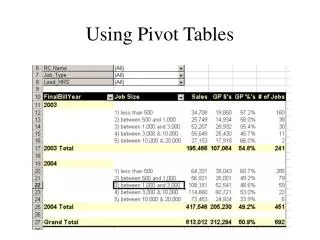
Pivot Table Defined “A PivotTable provides an easy way to summarize information stored in a range, a table, or an external data source.” “…present endless rows and columns of numbers in a variety of meaningful ways” Source: Master Visually Excel 2010 Elaine Marmel
What type of Data? • Raw Data: un-processed, un-summarized • Numeric and Non-Numeric Data • Organized as a list with labeled columns • At least 3 columns of data • Data should be entered correctly • No gaps or blank spaces • List of anything • Employee Contact Details • Financial Transactions • Academic Year Course Information
Pivot vs. manual Report Pivot Table/Report Manual Report/Table Static Summary of Data Manually created (can take min - hrs) Difficult/tedious to change summary Create formulas to display data a certain way No automatic process to rotate data (manual) • Interactive Summary of Data • Created with a few mouse clicks (takes a few sec) • Easily Change summary • Formulas not required • Couple of clicks for summary to be “pivoted” (rotated) switch row to be column data
Creating Pivot Table Report • Steps to create a pivot table include: • Identify source data, must be Raw data • Identify where pivot table will go in workbook • Layout the fields • Report that provides concise and exact insight into the data you need to present. Demonstration + Activity Create a Pivot Table for Sample file using Raw data
Pivot Table Components • PivotTable Area • PivotTable Field List • Appears any time we click on PivotTable • Displays Column headings from Raw data • 4 boxes (report, column, row, values) • Choose way PivotTable summarizes data • Drag and drop fields to 4 drop zones
Drop Zones • Report Filter:Filter out data • Column Labels:determine the arrangement of data shown in the columns of the pivot table. • Row Labels:determine the arrangement of data shown in the rows of the pivot table. • Values:data that will appear in cells. Values are summarized (summing, avg. etc.)
Activity • Drag Orders to Report Filter • Drag SalesRep to Row Labels • Drag Total Sales to Values • Drag Date to Column Labels
Additional Formatting • Group Dates • Group by Month & Year • Value Field formatting • Number to Currency • Filter options • Filter by Order # • Apply a Design to Pivot Table • Design Tab • Change Layout and apply a style
Pivot Table Options • Options Tab Appears on Ribbon • Change Name for PivotTable • Hide/Unhide Grand Totals • Insert Slicers • Options > Sort & Filter > Insert Slicer • Visual way of filtering • Refresh • Change a value in source data • Options > Data Group > Refresh
PivotTable Options cont… • Change Data Source • Use to add extra column or change source • Recapture data without Date Info • Pivot Table Selection • Options > Actions: Useful if need to format sections of PT at a time • Enable Selection Arrow (Black arrow ) > select region & Edit • Move Pivot Table • Insert a PivotChart
Sparklines • Tiny chart inside a cell that provides a visual representation of data • Use to show trends at a glance for range of data. • Placed next to or near underlying data (in context)
Creating a Sparkline • Changes done to underlying data automatically transfer to sparkline • Sparklines are printed for worksheets that contain them • Use the “Sparklines” group (Line, column, win/loss) Demonstration + Activity: Create a line Sparkline for Sample file on PivotTable sheet
Activity • Open the file called SampleData_Orders.xlsx • Create a PivotTable and add sparklines
Before you Save & Print • Set Print Area • Specify Orientation/Margins • Scale to Fit on Page • Gridlines • Page Layout Tab and Page Set Up (file menu) Demonstration + Activity Set print area and page set up properties
Saving Options • Save as .xlsx • Save as Adobe PDF • Save as a .csv or .txt Demonstration + Activity: Save the report as a PDF
Printing Options • Print the Active Sheets • Print the Entire Workbook • Print Selection Demonstration + Activity Print selection only
Summary • Set up data in excel • Converted data into Table • Created a Pivot Table/Report • Added Sparklines • Saving and Printing Tips • Saved as PDF
Safari e-Books @ Library • Go to http://proquest.safaribooksonline.com/ • Search for Microsoft Office content
Workshop Survey • Please provide your feedback by going to: http://www.csus.edu/irt/STC/workshops/index.html • Find the Workshop Survey Link • Click the link to Workshop title attended • Complete Survey
Resources for Further Assistance Student Tech Center www.csus.edu/irt/stc 916-278-2364 stc@csus.edu Service Desk www.csus.edu/irt/servicedesk 916-278-7337 servicedesk@csus.edu