Download
1 / 46
470 likes | 622 Views
Resources, Growth and Sustainability. Outlines. Resource Scarcity The Limits to Growth Sustainability. 1. Resource Scarcity. Typically, one looks at figures on reserves, or the ratio of reserves to annual production, which gives the number of years to exhaustion. For example, for world oil:.

E N D
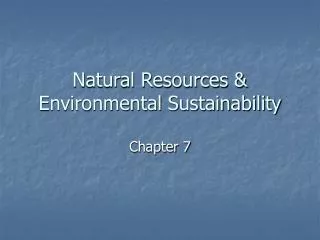
Outlines • Resource Scarcity • The Limits to Growth • Sustainability
1. Resource Scarcity • Typically, one looks at figures on reserves, or the ratio of reserves to annual production, which gives the number of years to exhaustion. • For example, for world oil: What’s happening?
Resource Scarcity • Note that reserves are defined as the known amount of a (mineral) resource that can be profitably recovered. This means that new technology, new discoveries, higher prices for the resource, all lead to an expansion in reserves, as we see in the case of oil.
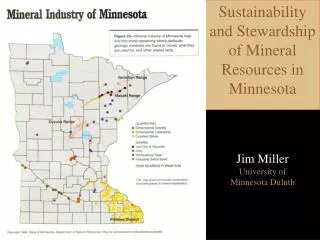
Increasing uncertainty Increasing cost Reserves Resources The relationship between resources and reserves is expressed in the McKelvey diagram, after Vincent McKelvey, former head of the USGS.
Resource Scarcity • Not only do reserves typically increase over time, as in the case of world oil, but the reserves/production ratio is often approximately constant over time, as in the case of oil over the period 1955-1972 and 1990-2000. In fact, the apparent increase from 1972 to 1990 may be due to a more inclusive classification of material as reserves by some countries. Why the constancy?
Resource Scarcity • Reserves can be regarded as inventory. A mining firm – or a government agency – doesn’t want to invest too much in costly exploration, though of course some amount will be desirable because it takes time to discover and develop reserves. Thus there is an optimal inventory, which should be approximately constant over time. Observed variations may be explained by the uncertainty of the discovery process, and the “lumpiness” of discoveries.
Resource Scarcity • We conclude that estimates of resources, or reserves/production ratios, are not good indicators of “Malthusian” resource scarcity, or impending resource exhaustion. • What is wanted is an indicator of ultimate availability of a resource or resources. This is given by a measure of the physical limits, such as crustal abundance (CA) or the amount available above the “mineralogical threshold” (MT).
For a number of minerals, as of 1974 (the figures would not be much different today):
Resource Scarcity • Clearly CA is too much of a good thing, and is misleading, since it ignores the costs of finding, developing, extracting, and transporting resource deposits, as well as the environmental costs associated with processing such an enormous volume of material. CA also ignores what people would be willing to pay for high cost resources, given the presence of substitutes in production and consumption. • MT in the table represents 0.01% of CA to a depth of one kilometer, which is the amount of copper available in its “own” deposits, i.e., not just as a trace element in silicates, to a depth of one kilometer.
Resource Scarcity • This is probably a more meaningful measure of scarcity than either reserves or CA, but it is arbitrary, and may not be applicable to materials other than copper. More importantly, it represents a very crude attempt to take into account economic considerations such as cost and willingness-to-pay. • These considerations are embodied in resource prices, on which we also have fairly good time series data. • Theory and empirical evidence tell us that in general as a good grows more scarce, its price rises. • Note: price is a forward-looking indicator, because it includes the royalty, the value of a unit of the resource (optimally) extracted in the future.
p p or t t What does the evidence show? For most resources, price has been either falling steadily, or first falling and then beginning to rise.
Resource Scarcity How can this be, if nonrenewable resource depletion theory says price is always rising as the resource is depleted: where p = price c = marginal cost of extraction r = the discount rate. or where cb = marginal cost of production from the backstop or substitute for the resource
p po . c t The contrary time series behavior can be explained by shocks to the system: new discoveries (of the resource, of substitutes), and technical change leading to the discovery of new deposits or the expansion of reserves – or a reduction in the cost of the backstop. These discoveries in effect expand the reserve base, and thus lower the scarcity value of reserves, the royalty, the second term on the right hand side in the price equation (lower cb, higher T, etc).
Conclusions • Reserves, or reserves/production ratios, are not useful as indicators of future scarcity, though they are commonly used for this purpose. • CA is also not useful; it is much too loose an upper bound. • MT represents a “middle ground” in physical measures of scarcity, but is a crude attempt to capture relevant economic considerations (cost, willingness to pay).
Conclusions • Time series of resource prices are good indicators of trends in scarcity, including anticipated future scarcity (through the royalty component of price) -- though not a good test of simple optimal depletion theory (because of shocks to the system such as new discoveries, technical change, and fluctuations in aggregate demand). • Resource price time series are generally declining, or first declining and then, very recently, beginning to rise generally declining scarcity, though this may be changing. (see Slade (1982), and Berck and Roberts (1996) for careful econometric studies)
p p t Aggregate t Copper Conclusions 6. Time series for a single resource, such as copper, more likely to turn up sooner than time series for resources as a group, because as the price of the single resource rises, the market substitutes away from it, as in the case of aluminum for copper, thereby reducing its weight in the market basket used to construct the aggregate price index.
2. The Limits to Growth (LTG) • The main and very well known result of the simulations in LTG (1972, 1992) is that per capita consumption is sharply and inevitably reduced, within a couple of decades in the base case, in several more decades under different assumptions, for example about the initial stock of resources or about the amounts of resources or pollution involved in production of a given output.
The Limits to Growth (LTG) Although the model underlying the simulations is complex and involves many assumptions and relationships, we can understand the results by focusing on just two key equations: (1) where c = per capita consumption, R = nonrenewable resources K = capital P = population or labor
The Limits to Growth (LTG) where is a resource use coefficient, e.g. 10 barrels of oil per capita, and is increasing with per capita consumption, ct. Thus R must be declining at an increasing rate with increases in population or per capita consumption; no substitution, and no technical change, as might for example be specified with . with
The Limits to Growth (LTG) • (Flow ∆) R and K are in fact complements, not substitutes, since as resources are depleted (flow ∆R), and population P is increasing, according to equation (1) the economy needs ever more capital K to maintain per capita consumption c, i.e., an increase in ∆R an increase in K. • This is the basic problem in the base case: no matter how large the initial stock of resources, it is inevitably depleted to the point where the economy can no longer sustain a constant level of consumption, much less increase the level.
The Limits to Growth (LTG) Alternatively, suppose, following Nordhaus (1973, 1992), and received economic theory and empirical findings, we specify a production function that allows for (limited) substitution and technical change: where h = rate of technical change = .025 in this simulation, L = land, and ∏ = pollution. With this specification (nested Cobb-Douglas) of production relations, there is no collapse in per capita consumption. Is it plausible? Yes, up to a point.
The Limits to Growth (LTG) There is much empirical evidence, and a theoretical basis, for a Cobb-Douglas production function with continuing technical change, as Nordhaus specifies, for the conventional inputs P, K, -∆R, and L. Further, we can certainly imagine substitution between pollution and conventional inputs, by using these inputs to capture and recycle or transform the residuals from production, producing a given level of output with less pollution but more of the other inputs.
The Limits to Growth (LTG) But this is not the only possibility. Let us rewrite Q as where RE = conventional, extractive resources, RN= natural capital (non-extractive). Now the question is, can K substitute for a loss of natural capital (-∆RN) in the same way it can for loss of extractive resources (-∆RE)? This brings us to the new literature on sustainability.
3. Sustainability • Suppose two economies produce the same conventionally measured national income, NNP (thus allowing for depreciation of capital), but one of them uses a large fraction of its R, which for the time being we’ll let stand for nonrenewable extractive resources, whereas the other one conserves its stock of R. It seems obvious that the second economy is in some sense doing better, though this is not reflected in measured NNP.
Sustainability There is in principle a way to adjust the national income accounts to reflect the change in the stock of resources, but it is difficult in practice, and much more difficult, as we shall see, when we expand the definition of R to include non-extractive natural capital. Further, the adjustment turns out to be essential in defining and measuring sustainability.
Sustainability NNP is adjusted, or corrected, to reflect the depletion of R (or net depletion, if there is also some discovery). How is the physical depletion evaluated, to make it commensurate with NNP? By its shadow price, or scarcity value, which is of course just the resource royalty, a measure of the value of the resource in the ground based on what it will (optimally) contribute to future production.
Sustainability • The adjustment thus = (-∆R) where is the royalty. • The royalty is not ordinarily observed, though in a competitive equilibrium it will be equal to the difference between price and marginal cost, and might also be inferred from bids on mineral or timber leases, which reflect the bidders’ estimates of the value of the resource in the ground, net of extraction costs.
Sustainability What is the link to sustainability? Define sustainability as the ability of each future generation to be as well of as its predecessors, that is, to be endowed with whatever it takes to produce a given standard of living (which might be defined by consumption, or more broadly by utility), say the present generation’s.
Sustainability What is the nature of the endowment? Resources, R, of course, but also capital, K, including stocks of human capital. A sustainable path is one that replaces whatever it takes from its inherited natural and produced endowment with more of the same, if possible, or other kinds of capital that can yield consumption or utility.
Sustainability How much replacement capital is needed? Clearly, enough to maintain the aggregate social capital stock. So the condition for sustainability is: invest aggregate resource rents or royalties in reproducible capital. where is the resource royalty and is the shadow price of capital.
Sustainability • This condition is known as the Hartwick Rule, after Hartwick (1977), who first derived it on the basis of a number of simplifying assumptions. Specifically, he showed that a constant level of per capita consumption would be generated by investment of aggregate royalties from nonrenewable resources in the formation of capital, where resources and capital are the only two inputs to a Cobb-Douglas production function for a single consumption good output. It has since been extended and modified to apply more generally. • Note that there is a very strong assumption here, namely that it is possible to substitute capital for resources.
Sustainability • Consider a vector of capital and resource stocks, where we now distinguish different types of capital and resources: • The value of the aggregate capital stock, including stocks of resources, which we might now expand to refer to all forms of natural capital, both extractive and non-extractive, as in the preceding discussion, is where is the shadow price of K1, 1 is the shadow price of R1, and so on.
Sustainability • The substitutability assumption is that a depletion of, say, R1, where R1 is a conventional extractive resource, evaluated as 1(-∆R1), can be compensated by investment in say K1, such that • Suppose this is not true for all Ri, i.e., suppose some elements of the natural capital stock can not be substituted. Then either sustainability is not possible, or sustainability requires that the economy maintain a stock, perhaps the existing stock, of the non-substitutable natural capital.
Sustainability This is called “strong sustainability”. Maintaining the aggregate capital stock (natural and produced) via replacement investment in producible capital, is called “weak sustainability”. In theory, and in practice, we might expect a mix of both in pursuit of a sustainability objective.
Sustainability A very important point to note here in connection with possibilities for substitution is that substitution can be accomplished by changing the capital-intensity mix of the consumption good, or perhaps more intuitively, substituting in consumption, away from goods that require the particular non-substitutable natural capital input and in favor of goods that do not require this input.
Two issues remain • Which elements of R (which Ri) in fact fall into the category of non-substitutable? This is a crucial empirical question if sustainability is a policy objective. • At what level should the non-substitutable stocks be maintained? Must it be the current level? The maximum sustainable level? Some minimum level below which essential services can no longer be provided, or other adverse consequences follow? We thus conclude by focusing on empirical issues of substitutability – and technical change, which can obviously affect prospects for substitution – much as in the discussions of resource scarcity and limits to growth.
An interesting conceptual and empirical approach to sustainability is provided by: Arrow et al (Journal of Economic Perspectives, 2004) • The concept of sustainability was put on the map by the report of the World Commission on Environment and Development (1987), also known as the Brundtland Commission, after the Chair, the Prime Minister of Norway. • Sustainable development was defined as: “Development that meets the needs of the present without compromising the ability of future generations to meet their own needs.”
As Arrow et al note, several interpretations of sustainability are compatible with this definition. Their approach, which leads to a criterion for sustainability essentially the same as the one we have already put forward, is as follows. Define intertemporal social welfare V at time t as the present discounted value of the flow of utility from consumption from the present to infinity, discounted using the constant rate .
In symbols, Note that Vt is a function of the stock of all of society’s productive assets Kt (human capital, physical capital, natural capital, etc) at time t, and also of time t. In the case where V is stationary (t itself does not directly influence V ), Vt is a function of Kt: Vt = V(Kt).
Now we can define sustainability in terms of V and K: The sustainability criterion is satisfied at time t if: Let Kit denote the stock of the i’th capital good at date t. By the chain rule of differentiation
Genuine investment, in Arrow et al where pit is the shadow accounting price of Kit and Iit is the change in Kit over the short interval . Then
Several features of this criterion for sustainability deserve emphasis: 1. Even if a consumption path were to satisfy the criterion today and at all future dates, it would not guarantee that utility U at each future date will be as high as it is today. 2. The criterion does not identify a unique consumption path; it could in principle be met by many paths. 3. If exhaustible resources are sufficiently important in production and consumption, then it is conceivable that no sustainable development program exists.
4. Satisfying the sustainability criterion today does not guarantee that it will be satisfied at all future times; a given consumption path may imply a rising V over the interval from now to the next period, but a falling V when it is evaluated over some future interval of time. 5. There is no presumption that a sustainable consumption path is optimal in the sense of maximizing V. An empirical application, a calculation of the sustainability of development in several countries and regions, is given by Arrow et al in Tables 1 and 2.