Download
1 / 1
10 likes | 104 Views
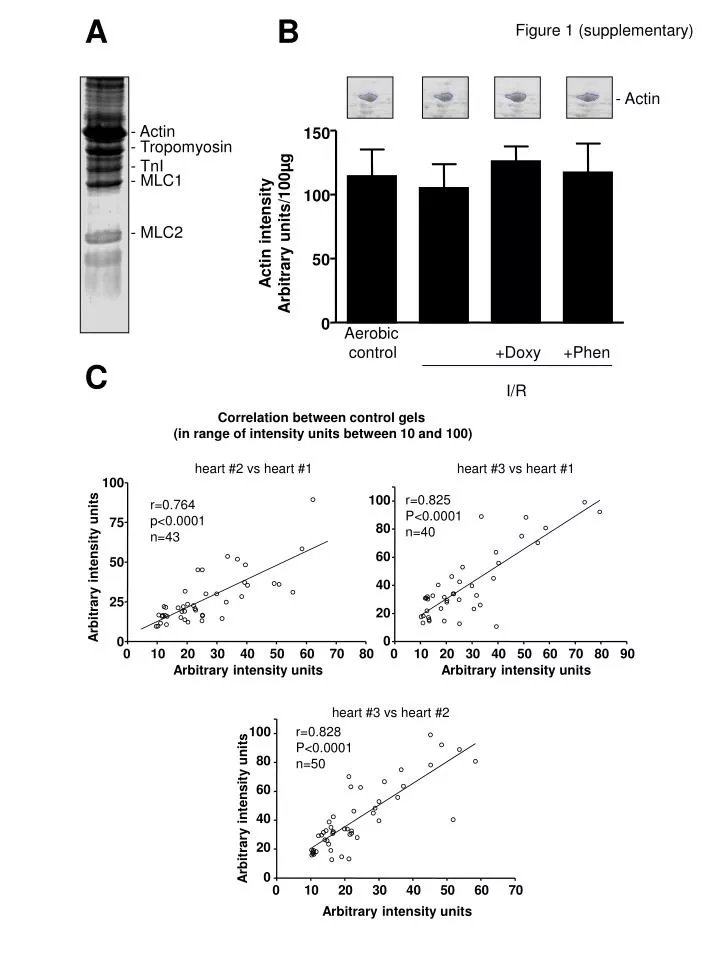
- Actin. - Actin - Tropomyosin - TnI - MLC1 - MLC2. 150. 100. Actin intensity Arbitrary units/100µg. 50. 0. Aerobic control +Doxy +Phen I/R. A B C. Figure 1 (supplementary). Correlation between control gels

E N D
- Actin - Actin - Tropomyosin - TnI - MLC1 - MLC2 150 100 Actin intensity Arbitrary units/100µg 50 0 Aerobic control +Doxy +Phen I/R A B C Figure 1 (supplementary) Correlation between control gels (in range of intensity units between 10 and 100) heart #2 vs heart #1 heart #3 vs heart #1 100 r=0.825 P<0.0001 n=40 100 r=0.764 p<0.0001 n=43 75 80 60 50 Arbitrary intensity units 40 25 20 0 0 0 10 20 30 40 50 60 70 80 0 10 20 30 40 50 60 70 80 90 Arbitrary intensity units Arbitrary intensity units heart #3 vs heart #2 100 r=0.828 P<0.0001 n=50 80 60 Arbitrary intensity units 40 20 0 0 10 20 30 40 50 60 70 Arbitrary intensity units