Download
1 / 23
230 likes | 321 Views
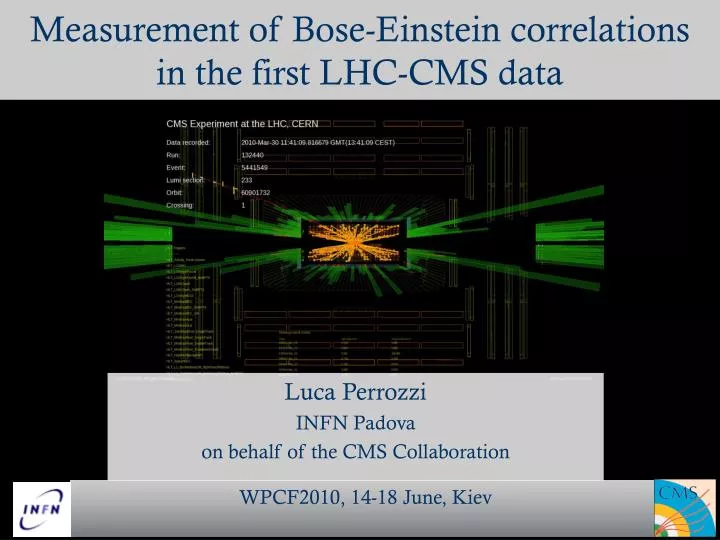
Measurement of Bose-Einstein correlations in the first LHC-CMS data. Luca Perrozzi INFN Padova on behalf of the CMS Collaboration. WPCF2010, 14-18 June, Kiev. L >> d. Introduction. Optics. r A1. P1. A. Plane wave. r B1. d. Monochromatic Source. B.

E N D
Measurement of Bose-Einstein correlations in the first LHC-CMS data Luca Perrozzi INFN Padova on behalf of the CMS Collaboration WPCF2010, 14-18 June, Kiev
L >> d Introduction Optics rA1 P1 A Plane wave rB1 d Monochromatic Source B The interference pattern is related to the “source geometry” (d) Particles The (symmetric) wave-function of identical bosons produced in High-Energy Collision overlaps: Bose-Einstein statistics changes their dynamics (a.k.a. Hanbury Brown-Twiss, HBT) p1 p2 A B For four-momenta small differences, enhancement of the correlation function should be observed WPCF2010, 14-18 September, Kiev
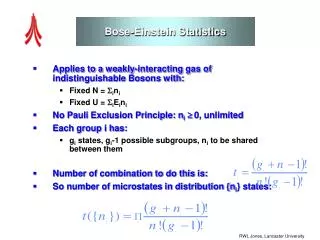
Introduction The correlation function is defined as the ratio: joint prob. for identical boson emission independent prob. for identical boson emission for incoherent sources the joint mean time probability gives the following correlation function: Experimentally the proximity in phase space can be quantified by the Lorentz-inv. parametrization • W is the Fourier transform of the spatial distribution of the emission region (static models) • l is the strength of the emission source • r is the radius of the emission source • d accounts for long range Q correlations WPCF2010, 14-18 September, Kiev
Introduction The Bose-Einstein correlation was observed for the fist time by Goldhaber (1960) in proton-antiproton interactions at √s = 2.1 GeV Several measurements have been reported by different experiments The most appropriate (Q) function, the value of the correlation source radius r and the their dependences (i.e. from √s or from the charged-particle multiplicity) are still open questions. For the first time we measured the Bose-Einstein correlation in proton-proton collisions at √s = 900 GeV and √s = 2.36 TeV (December 2009 LHC-CMS data) √s Min. Bias sel. events # tracks # sel. tracks # sel. pairs 900 GeV~ 280 k ~ 5500 k ~ 2900 k ~ 11 M 2.36 TeV~ 14 k ~ 360 k ~ 190 k ~ 1 M WPCF2010, 14-18 September, Kiev
CMS Inner Tracker WPCF2010, 14-18 September, Kiev
Reference samples the distribution of pairs of the same charge a similar distribution with non interfering track pairs R(Q) is measured by dividing: • We considered pairs from 7 reference samples: • opposite charge (natural choice but contains resonances) • opposite hemisphere same charge ( p → -p for one track) • opposite hemisphere opposite charge • rotated ( [px , py , pz] → [-px , -py , pz] for one track ) • mixed events(random) • mixed events (similar multiplicity) • mixed events (similar invariant mass of all charged particles) WPCF2010, 14-18 September, Kiev
Reference samples • As an example the ratio R(Q) obtained with: • opposite-hemisphere same charge • shows a significant excess at small Q values • (in the default MC the Bose-Einstein correlation is not simulated) dN/dQ R (Q) PRL 105, 032001 (2010) WPCF2010, 14-18 September, Kiev
Coulomb interactions Coulomb interactions modify the relative momentum pair distribution following the Gamow factors (not simulated in the Monte Carlo): same charge: Ws= (e2 -1) / 2 different charge: WD= (1-e2) / 2 different charge before Gamow correction after Gamow correction (WD) The Gamow factor correction is tested with the different charge distribution and applied to the same charge and different charge distributions WPCF2010, 14-18 September, Kiev
Double ratio In order to reduce the bias due to the construction of the reference samples a double ratio R is defined: R (double ratio) R (single ratio) CMS PAS QCD-10-003 CMS PAS QCD-10-003 WPCF2010, 14-18 September, Kiev
Check 1: reconstruction bias Pythia includes the functionality to simulate the Bose-Einstein correlation. To check against possible biases due to the reconstruction we compared the fitted parameters in the generated tracks and reconstructed tracks Dedicated Monte Carlo: MSTJ(51)=1 PARJ(92)=0.9 PARJ(93)=0.125 Generated Reconstructed WPCF2010, 14-18 September, Kiev
Check 2: particle identification • The signal sample is a pair combination between tracks with same charge. • As a cross check the dE/dx measurements are used to select • enriched sample • another sample with and non- candidates R (using dE/dx) dE/dx PRL 105, 032001 (2010) WPCF2010, 14-18 September, Kiev
Parametrization Different (Q) functions where tested (Exponential, Gaussian, Levy, Kozlov Gaussian, Kozlov exponential) Gaussian form (Q) = exp [ -(Qr)2 ] Exponential form (Q) = exp (-Qr) CMS PAS QCD-10-003 CMS PAS QCD-10-003 WPCF2010, 14-18 September, Kiev
R(Q) for all reference sample @ 900 GeV Exponential form (Q) = exp (-Qr) How to “combine” them ? WPCF2010, 14-18 September, Kiev
Combined reference sample The parameters of the correlation function were obtained using a “combined “ reference sample r.m.s. from each individual fit provides the systematic error contribution PRL 105, 032001 (2010) 900 GeV Combined reference sample Gaussian and exponential fit 2.36 TeV WPCF2010, 14-18 September, Kiev
Results Systematics: ± 7% for λ± 12% for r Several reference samples none is perfect ± 2.8% for λ± 0.8% for r The Coulomb interactions were considered with the Gamow factor corrections. The estimated uncertainty for WS is ±15% Measurement @ 2.36 TeV Measurement @ 900 GeV λ = 0.625 ± 0.021stat ± 0.046sys r = 1.59 ± 0.05stat ± 0.19sys λ = 0.662 ± 0.073stat ± 0.048sys r = 1.99 ± 0.18stat ± 0.24sys WPCF2010, 14-18 September, Kiev
Results Comparison with previous measurements Most of the previous experiments provided r measurement with a “traditional” Gaussian fit. The comparison can be done between first momentum with a scale factor √ : • PS: We performed the analysis also on 7 TeV data • Results are still not public • We would like to understand in deeper detail some results • Hopefully we will have a new document in the next months • Stay tuned! WPCF2010, 14-18 September, Kiev
Dependencies Charged track multiplicity dependence arXiv:1005.3294v1 Small dependence of λ from NCH Significant increase of the size of the emission region r as the charged track multiplicity increases WPCF2010, 14-18 September, Kiev
Conclusions • The signal of the Bose-Einstein correlation has been observed for • the first time in proton-proton collisions at √s of 900 GeV and 2.36 TeV • the exponential form(Q) = exp (-Qr) fits the data significantly better • with respect to the Gaussian form • the radius of the emission source measured from the fit is • r = 1.59 ± 0.2 (900 GeV) r = 1.99 ± 0.3 (2.36 TeV) • an increase of the parameterrwith charged-particle multiplicity in the • event is observed • The result have been published on PRL • (DOI: 10.1103/PhysRevLett.105.032001)URL: http://link.aps.org/doi/10.1103/PhysRevLett.105.032001 WPCF2010, 14-18 September, Kiev
Backup slides WPCF2010, 14-18 September, Kiev
Event and track selection Event selection The events were selected by requiring activity in both CMS beam scintillator counters Track selection • Charged particles are selected to increase their purity, ensure good two-track separation and remove pathologies: • Ndof > 5 • “track high purity” selection • pt > 200 MeV/c • fit χ2 < 5 • |ηtrack| < 2.4 • |dxy| BS < 0.15 cm (transverse impact parameter w.r.t. the collision point) • Rxy < 20 cm (first measured hit w.r.t. the primary vertex) WPCF2010, 14-18 September, Kiev
Previuos experiments: table WPCF2010, 14-18 September, Kiev
Detailed results @ 900 GeV WPCF2010, 14-18 September, Kiev
Detailed results @ 2.36 TeV WPCF2010, 14-18 September, Kiev