Download
1 / 52
520 likes | 631 Views
Cool-Season High Wind Events in the Northeast U.S. Jonas V. Asuma , Lance F. Bosart , Daniel Keyser Department of Atmospheric and Environmental Sciences University at Albany/SUNY John S. Quinlan, Thomas A. Wasula , Hugh W. Johnson, Kevin S. Lipton NOAA/NWS, Albany, NY

E N D
Cool-Season High Wind Events in the Northeast U.S. Jonas V. Asuma, Lance F. Bosart, Daniel Keyser Department of Atmospheric and Environmental Sciences University at Albany/SUNY John S. Quinlan, Thomas A. Wasula, Hugh W. Johnson, Kevin S. Lipton NOAA/NWS, Albany, NY Master’s Thesis Seminar 8 July 2010 NOAA/CSTAR Grant NA07NWS4680001
Overview Nonconvective wind fatalities • Motivation • Cool-season high wind events can be damaging and in some cases challenging to forecast • Objectives • Assess frequency of high wind events • Identify mechanisms that lead to severe surface winds • Present case study of one extraordinary event Tree-related nonconvective wind fatalities Fatalities due to various wind-related hazards, 1980–2005. From Ashley and Black (2008)
Outline • Background • Data/Methodology • Climatology • Composite Analysis • Case Study • Synthesis/Conclusions
Background: Thunderstorm winds • Thunderstorm wind climatology • Kelley et al. (1985): Nontornadic severe thunderstorm wind • Thunderstorm winds driven by evaporatively-cooled downdrafts • Downbursts (Fujita and Byers 1977), bow echos (e.g., Fujita 1978), derechos (Johns and Hirt 1987) • Mesovortices can modulate location of strongest winds (e.g., Trapp and Weisman 2003) • Johns (1993): • Described favorable cool-season pattern for development of squall lines with extensive bow echo-induced wind damage From Kelley et. al (1985) From Johns (1993)
Background: Gradient winds • Kapela et al. (1995) constructed a checklist of features associated with the occurrence of strong post cold-frontal winds: • Strong unidirectional flow throughout the troposphere, tropospheric-deep cold advection, steep low-level lapse rates, subsidence, presence of a dry intrusion, strong isallobaric gradient • Niziol and Paone (2000): Identified typical cyclone track associated with high winds impacting Buffalo, NY • Also noted many features determined by Kapela et al. (1995) L L L t = 00 h t = −12 h t = +12 h
Background: Case Studies • McCann (1978) determined necessary conditions for convective storms to produce high winds without lightning: • Small amount of potential instability, synoptic scale lifting, strong winds at 3 to 5 km above surface • Conditions met during winter • Koch and Kocin (1991) and Browning and Reynolds (1994) studied high-wind producing rain bands • Noted importance of dry intrusion on rain band and high wind development • High winds occurred during and shortly after cold front passed • Van den Broeke et. al (2005) studied the lightning production of two low CAPE, high shear convective lines • Conclusions suggest the occurrence of high wind during the cool season not as dependent on CAPE as in the warm season
Data • Climatology • NCDC thunderstorm and high wind reports • National Lightning Detection Network (NLDN) data • Composites • NCDC thunderstorm and high wind reports • NCEP/NCAR 2.5° Reanalysis data • Case Studies • NCDC thunderstorm and high wind reports • 1° Global Forecasting System (GFS) analyses • WSI 2-km NOWRAD Radar composites • National Lightning Detection Network (NLDN) data • Hourly surface observation data
Methodology (1 of 2) • Event determination • Domains: High wind reports from the Northeast (NE) for 15 Oct 1993 through 31 Dec 2008 • High wind definition: Wind measured ≥ 25 m s−1 or damaging winds of any magnitude • Event definition: Any series of storm reports that are separated from each other by ≤ 12 h • Events defined by type: • Pure Gradient (PG): Only gradient wind reports • Hybrid (HY): Both thunderstorm and gradient wind reports • Pure Convective (PC): Only thunderstorm wind reports • PG events: If lightning struck within 1° radius and 1 h from any gradient wind report, PG event becomes HY event
Methodology (2 of 2) • Composite • HY and PG event types subdivided based upon location of initial NE report relative to surface cyclone • Northeast, Southeast, Southwest, Northwest quadrants • PC events subdivided into trough and ridge categories • Composite time (t = 00 h): Determined to be hour (00, 06, 12, or 18 Z) closest to initial NE report • For reports at 03, 09, 15, or 21 Z earlier hour chosen • Events composited by event type and subcategory • Created report-relative composites • Grids shifted to location of initial NE report • Composites centered on centroid of initial NE reports for each event type and subcategory
Climatology: High-wind days Thunderstorm Gradient (%) Shaded represents the percentage of the total days (N = 3260) studied that high winds occurred.
Climatology: High-wind days Thunderstorm Gradient (%) Shaded represents the percentage of the total days (N = 3260) studied that high winds occurred.
Climatology: Event type Histogram depicting the frequency of occurrence based upon the type of event
Climatology: Yearly Histogram depicting the frequency of occurrence based upon the month in which the initial NE report occurred
Climatology: Monthly Histogram depicting the frequency of occurrence based upon the month in which the initial NE report occurred
Climatology: Hourly Histogram depicting the frequency of occurrence based time of the initial NE report
Climatology: Societal Impact Events that accumulated > 100 reports: HY: 27; PG: 2; PC: 0 Approximate average reports per event: HY: 60; PG: 20; PC: 11 Histogram depicting the frequency of occurrence based upon the number of reports accumulated
Climatology: Subcategories Histogram depicting the frequency of occurrence based either the location of the initial report or upper-level flow pattern
Climatology: Subcategories Focus on these for composite analysis Histogram depicting the frequency of occurrence based either the location of the initial report or upper-level flow pattern
Southeast Composite: Surface t = 00 h HY (N = 71) PG (N = 45) (mm) MSLP (hPa, solid); precipitable water (mm, shaded); 1000–500 hPa thickness (dam, dashed); 1000 hPa total wind (kt, barbs); initial report (star)
Southeast Composite: Cyclone Track +24 h PG (N = 45) −24 h HY (N = 71) t = 00 h Loci of initial report Six Hourly Southeast Composite Cyclone Track: Pure Gradientvs. Hybrid; MSLP (hPa) is boxed; initial NE report (star)
HY Southeast Composite: Cross Section HY (N = 71) (%) θe(K, black); relative humidity(%, shaded); vertical motion (μb s−1, solid; red-upward, blue-downward); total wind (kt, barbs); initial report (star)
PG Southeast Composite: Cross Section PG (N = 45) (%) θe(K, black); relative humidity(%, shaded); vertical motion (μb s−1, solid; red-upward, blue-downward); total wind (kt, barbs); initial report (star)
PG Southwest Composite: Surface t = 00 h PG (N = 55) (mm) MSLP (hPa, solid); precipitable water (mm, shaded); 1000–500 hPa thickness (dam, dashed); 1000 hPa total wind (kt, barbs); initial report (star)
PG Southwest Composite: Cross Section t = 00 h PG (N = 55) (%) θe(K, black); relative humidity(%, shaded); vertical motion (μb s−1, solid; red-upward, blue-downward); total wind (kt, barbs); initial report (star)
PG Southwest Composite: Sounding PG (N = 55) Composite sounding taken at the location of composite initial NE report at t = −06 h, t = 00 h, and t = +06 h
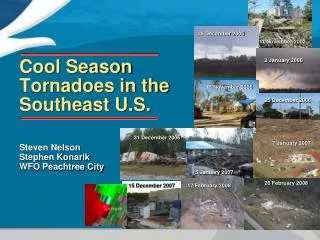
17 Feb 2006: Overview 85 kt gust at 15 Z • Resulted in two fatalities • Caused $3.5 million in damage in New York State • Produced 85 kt wind gust recorded at Saratoga County Airport • Accumulated most high wind reports in the NE (267 total reports) • 242 gradient reports • 25 thunderstorm reports • Fits the HY southeast and PG southwest paradigms All High Wind Reports Gradient Thunderstorm
17 Feb 2006: Cyclone Track +24 h −24 h 17 Feb case HY composite (N = 71) t = 00 h Loci of initial NE report Six Hourly Cyclone Track: MSLP (hPa) is boxed; initial NE report (star)
16 Feb 2006: Surface t = −12 h 18 Z storm reports Composite (mm) MSLP (hPa, solid); precipitable water (mm, shaded); 1000–500 hPa thickness (dam, dashed); 1000 hPa total wind (kt, barbs)
17 Feb 2006: Surface t = 00 h 06 Z storm reports Composite (mm) MSLP (hPa, solid); precipitable water (mm, shaded); 1000–500 hPa thickness (dam, dashed); 1000 hPa total wind (kt, barbs)
17 Feb 2006: Surface t = +12 h 18 Z storm reports Composite (mm) MSLP (hPa, solid); precipitable water (mm, shaded); 1000–500 hPa thickness (dam, dashed); 1000 hPa total wind (kt, barbs)
17 Feb 2006: Radar/Surface Obs 17 FEB 06: 12 Z t = +06 h
17 Feb 2006: Radar/Surface Obs 17 FEB 06: 12 Z t = +06 h Lightning Gradient Thunderstorm
17 Feb 2006: Radar/Surface Obs 17 FEB 06: 15 Z t = +09 h Post-Frontal Gusting Pre-Frontal Gusting Multiple Bowing Segments
17 Feb 2006: Radar/Surface Obs 17 FEB 06: 15 Z t = +09 h Lightning Gradient Thunderstorm
17 Feb 2006: Radar/Surface Obs 17 FEB 06: 18 Z t = +12 h
17 Feb 2006: Radar/Surface Obs 17 FEB 06: 18 Z t = +12 h Lightning Gradient Thunderstorm
17 Feb 2006: CAPE/Shear t = +12 h 18 Z t = +06 h 12 Z storm reports storm reports (J kg−1) 500 hPaZ (hPa, solid); CAPE (J kg−1, shaded); 1000–500 hPa shear (kt, barbs)
17 Feb 2006: Dry Intrusion 12 Z ERI BOS BGM ERI BGM BOS 42 N, −90 W 42 N, −60 W (%) θ(K, red); relative humidity(%, shaded); potential vorticity (10−6 K m2 s−1 kg−1, black)
17 Feb 2006: θe Advection 12 Z ERI BOS BGM ERI BGM BOS 42 N, −90 W 42 N, −60 W (10−4K s−1) θ(K, solid),θeadvection (10−4K s−1, shaded), potential instability (K km−1, dashed)
17 Feb 2006: Frontogenesis 12 Z ERI BOS BGM ERI BGM BOS 42 N, −90 W 42 N, −60 W [K (100 km)−1 (3 h)−1] θ(K, solid), Petterssen front. [K (100 km)−1 (3 h)−1, shaded], vertical motion (μb s−1, dashed; red-upward, blue-downward)
17 Feb 2006: Wind Profile 12 Z ERI BOS BGM ERI BGM BOS 42 N, −90 W 42 N, −60 W θ(K, solid), vertical motion (μb s−1, dashed; red-upward, blue-downward), total wind (kt, barbs)
17 Feb 2006: Dry Intrusion 18 Z ERI BOS BGM ERI BGM BOS 42 N, −90 W 42 N, −60 W (%) θ(K, red); relative humidity(%, shaded); potential vorticity (10−6 K m2 s−1 kg−1, black)
17 Feb 2006: θe Advection 18 Z ERI BOS BGM ERI BGM BOS 42 N, −90 W 42 N, −60 W (10−4K s−1) θ(K, solid),θeadvection (10−4K s−1, shaded), potential instability (K km−1, dashed)
17 Feb 2006: Frontogenesis 18 Z ERI BOS BGM ERI BGM BOS 42 N, −90 W 42 N, −60 W [K (100 km)−1 (3 h)−1] θ(K, solid), Petterssen front. [K (100 km)−1 (3 h)−1, shaded], vertical motion (μb s−1, dashed; red-upward, blue-downward)
17 Feb 2006: Wind Profile 18 Z ERI BOS BGM ERI BGM BOS 42 N, −90 W 42 N, −60 W θ(K, solid), vertical motion (μb s−1, dashed; red-upward, blue-downward), total wind (kt, barbs)
17 Feb 2006: Isallobaric Wind t = +12 h 18 Z t = +06 h 12 Z −32 −28 +28 +24 storm reports storm reports MSLP (hPa, solid), 12-hr centered pressure change (hPa (12 h)−1, dashed); 1000 hPaisallobaric wind (kt, barbs)
Case Study Conclusions • Strong forcing associated with the passage of a front in the presence of a potentially unstable air mass leads to development of a convective line • Vertical differential θe advection and an upper-tropospheric dry intrusion lead to mid-level drying • Deep cold-air advection in the presence of steep low-level lapse rates and strong low-level flow leads to high winds behind the cold front • Boundary layer stability and kinematic profile favorable for turbulent momentum transport • Isallobaric wind likely enhanced low-level flow
Synthesis/Conclusions • This work represents the first time thunderstorm AND gradient wind events have been looked at from a climatology and composite perspective • 17 Feb 2006 case is consistent with previous studies of cool-season high wind events • HY events tend to be the highest impact events • HY synoptic set up is essentially a combination of the composites constructed by Niziol and Paone (2000) and the conceptual model of Johns (1993)
Synthesis/Conclusions Gradient Tstorm • HY event conceptual model • High wind threat area in red shading Conceptual Model of the typical HY event
Thank You! • Lance and Dan • John, Tom, Hugh, and Kevin • Stuart Hinson at NCDC • Fellow graduate students • Most notably: Ben, Natalie, Melissa, Tom, Jay, Nick, Heather, Alan, Matt • Professors and Faculty • Ross, Kevin, Vince, Paul, Mathias, Chris, Ryan, etc. • And of course, my family