Download
1 / 36
360 likes | 511 Views
Using Volunteer Water Quality Monitoring Data One Watershed Association’s Story. Steven Yergeau, Watershed Assessment Specialist Stony Brook-Millstone Watershed Association 31 Titus Mill Road Pennington, NJ 08534 www.thewatershed.org www.thewatershedinstitute.org www.giscenter.org.

E N D
Using VolunteerWater Quality Monitoring DataOne Watershed Association’s Story Steven Yergeau,Watershed Assessment Specialist Stony Brook-Millstone Watershed Association31 Titus Mill RoadPennington, NJ 08534 www.thewatershed.org www.thewatershedinstitute.org www.giscenter.org
Using Water Monitoring Data This presentation is simply an overview of the different ways that we have used the data collected through our volunteer water quality monitoring program, StreamWatch.
Using Water Monitoring Data WARNING This presentation assumes that the data has already been entered into a usable database and has been analyzed into a usable format.
Using Water Monitoring Data STREAMWATCH: VOLUNTEER WATER QUALITY MONITORING PROGRAM • Chemical Action Teams (CATs) • Biological Action Teams (BATs) • River Action Teams (RATs)
Using Water Monitoring Data CATs • Started in 1992 • Chemically measure 6 parameters to determine water quality • 27 sites within the Millstone Watershed monitored every other weekend
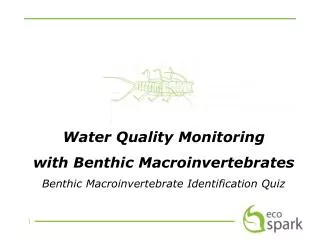
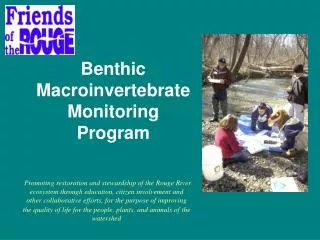
Using Water Monitoring Data BATs • Started in 1996 • Monitor aquatic macroinvertebrate populations to determine impact of pollutants on stream organisms • 12 sites monitored in March, July and October
Using Water Monitoring Data RATs • Started in 1996 • Visually assess the health of waterways by noting erosion, algal blooms, and land-use changes • 15 stream segments walked 4 – 6 times per year
Using Water Monitoring Data STREAMWATCH HAS FOUR GOALS: • To characterize the water quality of streams, rivers, and lakes in the Millstone Watershed. • To involve citizens in observing, monitoring, recording, and reporting stream conditions. • To motivate the public to initiate change in their use of the land and drainage systems that will enhance water quality. • To provide quality data to decision-makers which may bring about improvement in water quality.
Using Water Monitoring Data IMPORTANT When determining how to report your data, keep in mind your program goals and objectives, your audience, and your limitations in regards to staffing, funding, and expertise.
Using Water Monitoring Data Different ways that StreamWatch data is used: • For Water Quality Education • For Improving Water Quality
Using Water Monitoring Data Different ways that StreamWatch data is used: • For Water Quality Education - The place we start is with our own programs, our own volunteers, and our own communications with the outside world. • For Improving Water Quality
Using Water Monitoring Data Water Quality Education: VOLUNTEER NEWSLETTER We publish a quarterly newsletter, The StreamWatcher, for our volunteers, environmental commissions and planning boards for towns in our watershed, and other watershed associations throughout New Jersey.
Using Water Monitoring Data Results are being published throughout 2002 to report on the past decade (1992 – 2001) for our chemical & biological assessment programs (CATs & BATs).
Using Water Monitoring Data Water Quality Education: WEB SITE StreamWatch data is presented on our web site (www.thewatershed.org) through an interactive map depicting each site with graphs and descriptions of water quality over the past decade.
Using Water Monitoring Data Using Water Monitoring Data
Using Water Monitoring Data Using Water Monitoring Data
Using Water Monitoring Data Different ways that StreamWatch data is used: • For Water Quality Education • For Improving Water Quality – Keeping vigilant watch over our streams and rivers provides us the basic information to help clean up our streams and rivers. Monitoring water quality over a long period will enable us to determine water quality problems and address the source of the problems.
Using Water Monitoring Data Improving Water Quality: SITING RESTORATIONS Visual assessment reports collected through the RATs program are used to determine the best location(s) to place streambank restoration and streamside reforestation projects. Information built into the data sheet allows us to perform follow-up visits as necessary to determine suitability of site for potential restoration.
Using Water Monitoring Data Improving Water Quality: BEDEN BROOK CHARACTERIZATION & ASSESSMENT • We received funding through the 319(h) Clean Water Action Program for a 3-year project to assess the environmental health of smaller sub-watersheds within the Millstone Watershed. • Selected the Beden Brook Watershed • Gathered data to better understand the subwatershed • Analyzed the data • Selected appropriate restoration techniques as recommendations
Using Water Monitoring Data Data Collected: • The Landscape (Topography; Geology; Soils; E/T Species; Critical Habitats; KCSs; Point-Source Dischargers) • The Population • The Land Uses (Developed Lands; Forests; Agriculture; Impervious Cover; Riparian Corridors) • The Water Quality (RATs; BATs; CATs)
Using Water Monitoring Data RATs - • Problems with certain sections of streams. • Generally, these problems occur in sections farthest downstream. • Most common problems seen were erosion and heightened algal growth. • These impacts are most often associated with non-point source pollution from land-use disturbances.
Using Water Monitoring Data BATs – • Health of home waterway reflected by aquatic macroinvertebrate population. • Therefore, they are used as indicators of the levels of pollution in a waterway. • The 1992 State Water Quality Inventory Report states that a decline in biological health was noted from 1987 to 1991, with nutrient enrichment as one source of impairment.
Using Water Monitoring Data CATs – • Major water inputs are from surface runoff. • Thus, non-point source pollution, associated with suburban development and activities, is of particular concern. • Overall, DO levels do not violate the Surface Water Quality Standards. • For nitrates and orthophosphates, the headwaters of Beden Brook have good water quality. • At BD4, the nutrients show a slight increasing trend from 1992-2000. As the flow continues downstream towards BD3, the nutrients show a greater increasing trend.
Using Water Monitoring Data Improving Water Quality: NJDEP’s 305(b) List The NJDEP monitors the biological health of streams every 5 years by sampling the aquatic macroinvertebrate populations. We monitor similarly 3 times/year and follow the same protocol for determining the ‘Score for Stream Impairment’ as the NJDEP. We have started talks with the NJDEP Bureau of Freshwater & Biological Monitoring and the 305(b) Coordinator to submit our data to supplement the State’s.
Lessons Learned fromVolunteer Monitoring • Start Small • Keep Your Goals, and Those of Your Volunteers, Realistic • Planning Pays Off • Make Connections • Develop Volunteer Leadership • Pamper Your Volunteers • Use Your Data