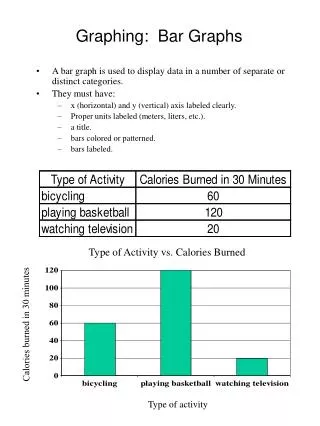
Download
1 / 27
310 likes | 951 Views
Graphing Techniques and Interpreting Graphs. 8 Rules of Graphing IV/DV. Graphs show relationships between variables:. Linear (directly proportional) Linear Non-Linear (indirectly proportional) Inverse Exponential or Quadratic Oscillating . 1. Linear Relationships (Directly Proportional).

E N D
Graphs show relationships between variables: Linear (directly proportional) Linear Non-Linear (indirectly proportional) Inverse Exponential or Quadratic Oscillating
1. Linear Relationships(Directly Proportional) • When the line of best fit is linear (a straight line), the variables are directly proportional to each other. • The equation y = mx + b defines the line. m represents slope b represents the y-intercept • As one variable increases, so does the other. y = mx + b
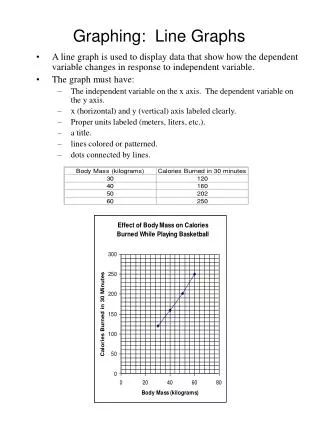
Linear Relationships(Directly Proportional) Graphing Data The slope is the ratio of the vertical change to the horizontal change. To find the slope, select two points, A and B, far apart on the line. The vertical change, or rise, Δy, is the difference between the vertical values of A and B. The horizontal change, or run, Δx, is the difference between the horizontal values of A and B.
Linear Relationships(Directly Proportional) Finding the Slope on a Linear Graph • Pick two points that are far apart on the line. They need not always be data points. • If y gets smaller as x gets larger, then Δy/Δx is negative, and the line slopes downward. • The y-intercept, b, is the point at which the line crosses the y-axis, and it is the y-value when the value of x is zero.
Linear Relationships(Directly Proportional) Example: Mass vs. Volume: As the volume increases, so does the mass. What is the equation of one of these lines? What are the units for its slope? What is the meaning of the slope?
Linear Relationships(Directly Proportional) Example: Mass vs. Length: As the mass increases, the length of the spring increases. Equation of the line? Slope of the line? Units of the slope?
2. Non-Linear Relationships:Inverse Relationship • y = k/x • As one variable increases, the other variable decreases • “k” is called a constant: …k is whatever number “fixes” the equation and makes it true for x and y.
Inverse Relationship y = k / x Example: As the speed increases, the time for the trip decreases. Can you figure out k? What are the units of k?
Inverse Relationship y = k / x Example: As the resistance increases, the current decreases. Can you figure out k? What are the units of k?
Other Non-Linear Relationships:Exponential Relationship • Examples: y = x2 y = x3 y = x -5 y = x 1/2 You cannot tell for sure whether a function is quadratic or exponential just from the graph. There are other functions whose graphs look like quadratics and exponentials. y = x2
Other Non-Linear Relationships:Quadratic Relationship • A quadratic relationship can be represented by the following equation: Shape is a parabola; has a maximum or a minimum, and is symmetric about a vertical axis. Often looks “U Shaped,” but can be deceptive; for example, if small portions are magnified they can look like straight lines.
Other Non-Linear Relationships:Oscillating Relationships Oscillating relationship: variables increase and decrease about each other. Examples: y = sin x y = cos x
Graphs show relationships between variables: Linear (directly proportional) Linear Non-Linear (indirectly proportional) Inverse Exponential or Quadratic Oscillating
Section Learning Check 1.3 Question 1 Which type of relationship is shown following graph? • Linear • Inverse • Exponential or Quadratic • None of the above
Section Learning Check 1.3 Answer 1 Answer:B Reason:In an inverse relationship a hyperbola results when one variable depends on the inverse of the other.
Section Learning Check 1.3 Question 2 What is line of best fit? • The line joining the first and last data points in a graph. • The line joining the two center-most data points in a graph. • The line drawn close to all data points as possible. • The line joining the maximum data points in a graph.
Section Learning Check 1.3 Answer 2 Answer:C Reason:The line drawn closer to all data points as possible, is called a line of best fit. The line of best fit is a better model for predictions than any one or two points that help to determine the line.
Section Section Check 1.3 Question 3 Which relationship can be written as y = mx? • Linear relationship • Quadratic relationship • Parabolic relationship • Inverse relationship
Section Section Check 1.3 Answer 3 Answer:A Reason:Linear relationship is written as y = mx + b, where b is the y intercept. If y-intercept is zero, the above equation can be rewritten as y = mx.
More Vocabulary: Interpolation--finding points between points. Extrapolation-- finding points beyond the last point.
Most Important: Linear Relationships Slope m=(40-8)/(50-10) m=32/40 m=0.8 g/cm3 Interpolation vs. Extrapolation
Density D = Densitym = MassV = Volume D = m / V Find the density of a sample whose mass is 25.0 g and whosevolume is 82.3 cm3. Find the mass of a sample whose density is 8.2 g/ cm3 andwhose volume is 52.0 cm3. Find the volume of a sample whose mass is 250 g and whosedensity is 6.3 g/cm3.
IV/DV con’t • The relationship between the independent and dependent variables is called a function. • Ex 1: The longer you walk, the greater the distance from where you started. • In this example, the independent variable is the time walking, and the dependent variable is the distance from the starting point. We can say that the distance covered is a function of time.
IV/DV con’t • Ex 2: Money earned and hours worked. • In this example, the amount of money you earn depends on the number of hours you worked. So the independent variable is the hours worked and the dependent variable is the money earned. Money earned is a function of the hours worked.
IV/DV Relationships Independent and dependent variables exist in relationships with one another. • Direct relationship: Both variables increase; on a graph, this line would have a positive slope. • Indirect relationship: One variable increases, the other decreases; on a graph, this line would have a positive slope. This is also called an inverse relationship.