Download
1 / 24
240 likes | 246 Views
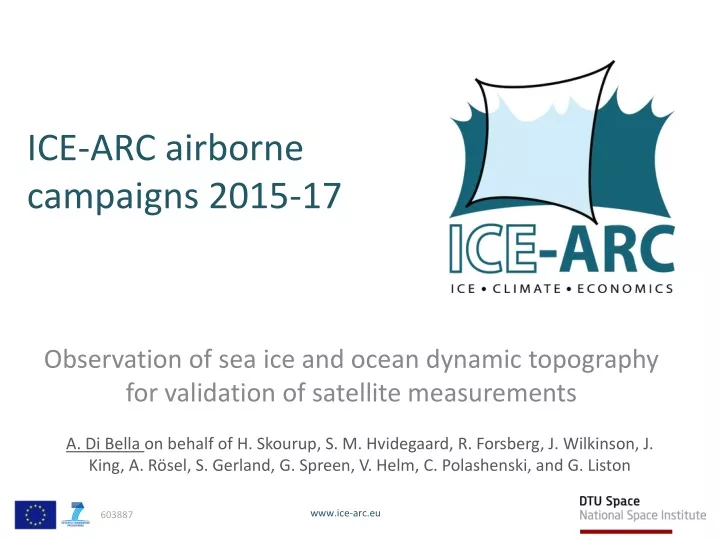
ICE-ARC airborne campaigns 2015-17. Observation of sea ice and ocean dynamic topography for validation of satellite measurements.

E N D
ICE-ARC airborne campaigns 2015-17 Observation of seaice and ocean dynamictopography for validation of satellitemeasurements A. Di Bella on behalf of H. Skourup, S. M. Hvidegaard, R. Forsberg, J. Wilkinson, J. King, A. Rösel, S. Gerland, G. Spreen, V. Helm, C. Polashenski, and G. Liston
ICE-ARC spring campaign 2015 Triangle RV Lance • Collaboration: NPI (N-ICE2015), BAS/DTU Space (EU FP7 ICE-ARC), CRELL, NASA OIB • Overflight of RV Lance: • OIB: March 19 • ICE-ARC: April 19 • ICE-ARC: April 24 ALS freeboards
ASIRAS radar and laser scanner Laser scanner (Riegl LMS Q240i Near-infrared, 40 Hz At 300m flight altitude Resolution: 1m x 1m Swathwidth: 300m ASIRAS Radar: ku-band (13.5 GHz) At 300m flight altitude Resolution: 10m x 3m Credits: Hendricks et al, IGARSS 2010 GPS kinematic positioning INS movements of the aircraft
Main purpose for ICE-ARC Airborne measurements with scanning lidar provide a detailed look on the structure of the sea ice, and together with snow depth measurements (from combined radar/laser measurements or models) provide a detailed measurement of sea ice thickness and ridge/lead distribution. The sea ice data from aircraft provide a detailed validation of satellite sea ice thickness data, as well as data on sea surface topography from e.g. CryoSat-2, Sentinel-3
Validation of CryoSat-2 Here is given a short summary of main findings in recently submitted paper to JGR special issue on N-ICE 2015 data: Comparison of freeboard retrieval and ice thickness calculation from ALS, ASIRAS, and CryoSat-2 in the Norwegian Arctic, to field measurements made during the N-ICE 2015 expedition By King, J., H. Skourup, S.M. Hvidegaard, A. Rösel, S. Gerland, G. Spreen, V. Helm, C. Polashenski, and G. Liston The ALS and ASIRAS data is from ICE-ARC flights around RV Lance on April 19 and 24, 2015
Laboratory experiments with ku-band radar on seaice with a layer of cold dry snow, Beaven et al, 1995 Laser Radar penetration depths
N-ICE in situ measurements Drillings from April 17-24, 2015: Sea ice freeboard is between -0.17 and 0.15m, with mean 0m Sea ice thicknesses between 0.81 and 2.70m, with mean 1.49m Snow depth between 0.13 and 1.12m with mean 0.48m GPS snow probe: 19-04-2015 The mean and mode snow depth was 0.40 cm. 24-04-2015 Snow depth had mean 0.56m and mode 0.5m.
ALS, ASIRAS and CryoSat-2 freeboards 19-04-2015 24-04-2015 PDF PDF Freeboard (m) Freeboard (m) *CryoSat-2 frb taken from ESA CryoSat-2 L2i product
ALS, ASIRAS and CryoSat-2 freeboards 19-04-2015 24-04-2015 There is very little or no (0-4 cm) penetration of the radar signal into the snow layer, and nothing comparable to the sea ice freeboard PDF PDF Freeboard (m) Freeboard (m) *CryoSat-2 frb taken from ESA CryoSat-2 L2i product
In situ measurements Temperature profiles from snow pit measurements This has already been addressed in papers, however, these are only speculating that there is no penetration for air temperatures above -10°C. On April 19 the snow-air temperature -16 C and snow-ice interface -6.7C. On April 24 these temparetures were -15C and -6.2 C. In between these dates the air temperature was between -13 and -25°C. However, a dense wind crust was observed near the air-snow surface in snow pits dug on the respective dates, which could possible prevent the radar signal to penetrate further into the snow layer. 19-04-2015 Blue 24-04-2015 Red
Freeboards from N-ICE Drillings from April 17-24, 2015: Sea ice freeboard is between -0.17 and 0.15m with mean 0 cm Sea ice freeboard = (Snow freeboard)ALS – (Snow depth)GPS snow probe At least half of the grid the sea ice freeboards are negative Similar conditions are found in Antarctica due to heavy snow load, and one has take this into account in the freeboard to thickness conversion (a) Snow depth from GPS snow probe (b) Snow freeboard from ALS (c) Sea ice freeboard = (b) – (a)
Freeboard to thickness From Kern et al. 2016, Remote Sensing, 8 (538), doi:10.3390/rs8070538
19-04-2015 24-04-2015 HEM thicknesses
19-04-2015 24-04-2015 HEM thicknesses
19-04-2015 24-04-2015 HEM thicknesses
Conclusion/summary • The radar freeboard from CryoSat-2 and ASIRAS is almostequal to the snowfreeboardobtained from ALS. • This is peculiar in this case, as the air temperature is below -13°C for the entireperiodbetween the 2 overflights. • The causecouldbe due to a densewindcrustlayerclose to the air-snowsurface. • Thereare large correlationbetween ALS, ASIRAS freeboards and HEM thicknesses, but nocorrelationbetween HEM thicknesses and CryoSat-2 freeboards. • Converting ALS and ASIRAS freeboardsintothicknessescorrelateswell with observed HEM thicknesses. • If ASIRAS freeboardsareconverted to thicknessesusing the general assumption of radar freeboard = icefreeboard, the thicknessesobtainedare 2-3 times toothick, whencomparedthicknessesobtained by HEM.
ICE-ARC spring campaign 2016 A small ICE-ARC 2016 airborne campaign was initiated and carried out to re-fly some flight lines (Triangle+ULS) from 2015, where data collected in 2015 were missing due to malfunctions of the BAS logging system. The campaign took place in beginning of April 2016 with shared aircraft mobilization costs with the ESA CryoSat-2 Validation Experiment (CryoVEx 2016). Triangle ULS
ALS long-term sea ice monitoring The data set is unique and covers 13 years of spring observations, and includes ICE-ARC measurements from 2016. The dotted lines mark datasets not covering the full flight line. Data from various campaigns show an overall thinning of the sea ice with large inter-annual changes overlaid.
ICE-ARC spring 2017 ? Flights in the Beaufort Sea to measure sea ice thickness and sea surface height to compare to buoy data (IMB and GPS) and validation of satellite measurements, sea ice thickness and sea surface height primarily from CryoSat-2, but also the freshwater component estimated by GRACE Sachs harbour • Logistics: • BAS TwinOtter • Base: Sachs Harbour, Banks Island, gateway to the BeaufortGyre • Instruments Lidar/ASIRAS radar
Development of UAV lidar system - In support of ICE-ARC field campaign Velodyne Puck lidar: 600g Penguin B is capable of up to 26.5 hour endurance with the 4 kg payload The Lidar has a range of 100 m, which is a perfect for relative flat surface topography, such as sea ice. The total weight of the instruments is only 2.5 kg including lidar, INS/GNSS, onboard controller unit, GPS antenna and cables.
Time schedule • Purchased instruments; light weight Lidar + integrated INS/GNNS, June 2016 • Setup and test of instruments in house, July-September 2016 • Installation of instruments in UAV, ongoing • Test flights of UAV with instruments; Beginning of November 2016 • Flights to test instruments and validate data in Denmark, • Test flights Greenland Station Nord, first 2 weeks of April 2017 • Field campaign from VRS Station Nord with coincident UAV/lidar for sea ice surface topography and under ice measurements of bottom of the ice, 2 last weeks of April 2017 Villum Research Station