Download
1 / 30
340 likes | 541 Views
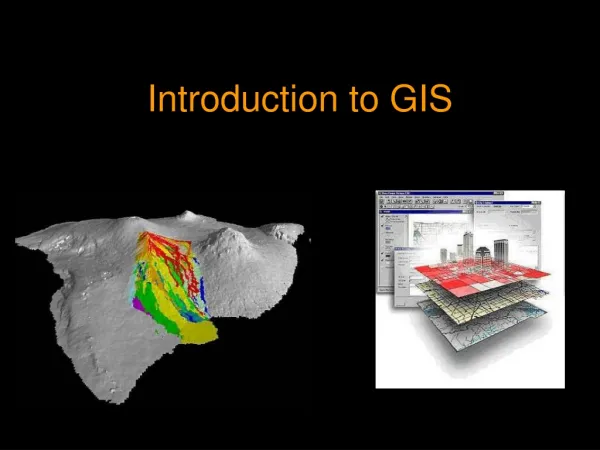
Introduction to GIS II. The software. We will use ESRI’s ArcGIS desktop - ArcView. ArcView, ArcEditor , and ArcInfo In each of the three you find: ArcMap : most of the work, create maps, query, analyze spatial patterns, and produce map layouts ArcCatalog : Browse and view spatial data

E N D
The software • We will use ESRI’s ArcGIS desktop - ArcView. • ArcView, ArcEditor, and ArcInfo • In each of the three you find: • ArcMap: most of the work, create maps, query, analyze spatial patterns, and produce map layouts • ArcCatalog: • Browse and view spatial data • add them to ArcMap • search by location, attributes, or metadata • preview and create metadata • ArcToolbox: tools to convert spatial data from one format to another and change map production • Assignments: use the data from the CD, or copy exercise data from c:/ESRIPress/GTKArcGIS to your desktop in More lab
Basic Concepts in ArcView GIS • A map document (.mxd) in ArcMap refers to all the files for a certain task . ArcView3.2 used a project document (.apr) • It includes data frames (views), tables, charts, layouts, and user defined programs. • Depending on which mode you are working in, the main menu options change. • A data frame (view) includes graphical representations (maps?). Features that share certain attributes are grouped in layers (themes) inside the table of contents. You can turn layers on and off. A layer contains a set of related features together with their attributes
Data frame Map display layer Table of contents
A data frame is an interactive map that lets you display, explore, query and analyze geographic data in ArcMap. • A data frame defines the geographic data that will be used and how it will be displayed, but it doesn't contain the geographic data files themselves. Instead, a data frame references these source data files. This means that a data frame is dynamic, because it reflects the current status of the source data. If the source data changes, a data frame that uses this data will automatically reflect the change the next time the data frame is drawn. It also means that the same data can be displayed on more than one view.
Tables include attributes of features, # of lanes in roads for example.
Charts and layouts can be produced and added to the map document (project). • Scripts include additional user defined programs in “Avenue” in ArcView 3.2 • ArcMap employs Visual Basic for Applications (VBA) macros • Run Ex. 5?
Notes about the book and software • The book is divided into 8 sections • Section 1( ch. 1,2): Getting to know Arc GIS, introduction, no software training • Section 2( ch. 3, 4): Getting started with maps and data. Interface, then ArcCatalog to learn how to browse, search, and add data to your project. • Section 3 (CH. 5, 6, 7): Displaying Data: symbolizing, classification, and Labeling feature
Notes about the book and software • Section 4: (ch. 8, 9) Getting information about features. Basically playing with attribute, Querying data, attribute based selection (8b), and joining and relating tables. • Section 5: (Ch. 10, through 13) Analyzing feature relationships. Spatial analysis: selection by location (neighborhoods with malls?), preparing data for analysis such as dissolve and clip, ANALYSING SPATIAL DATA: buffering and overlying. Projecting data in ArcMap
Notes about the book and software • Section 6: (ch. 14 through 17) Creating and editing data: building geodatabases, Creating features, editing: modify features, split and merge features, edit attributes, • Section 7: Presenting data: (ch. 18, 19)making maps from templates, and making maps for presentations. • Section 8: modeling
Definitions of GIS • Digital GIS started in the 60’s and grown dramatically in the 80’s • There is no agreement on a single definition of GIS. One definition is: An organized collection of computer hardware, software, geographic data, and personnel designed to efficiently capture, store, update, manipulate, analyze, and display all forms of geographically referenced information.
More definitions • David Rhind’s definition: A computer system for collecting, checking, integrating and analyzing information related to the surface of the earth. (Rehind, 1988). • Marble and Peuquet’s definition: GIS deals with space-time data, and often, but not necessarily, employs computer hardware and software. A GIS has the following subsystems: 1- A data input system that collects and preprocesses spatial data from various sources.
2- A data storage and retrieval subsystem that organizes the spatial data in a manner that allows retrieval, updating and editing. 3- A data manipulation and analysis subsystem that performs tasks on the data. 4- A reporting subsystem that displays all or part of the of the database in tabular, graphic, or map form. • It is important to know that GIS is not a computer software and that GIS expanded beyond many definitions. • Do you think that ArcView includes all the subsystems? • A GIS is an information system based on a database. It does not store images of maps. It stores data in a database from which you can create the desired view.
How is GIS Different • What is the main difference between a GIS and Computer Assisted Drafting (CAD)? • GIS analyses data while CAD constructs and illustrates data. • A GIS can take two or more data sets, analyze their integration, and generate totally new data sets. • Creating dynamic projects. • The ability to access the map from the information or access the information from the map.
Layers of data • the real world consists of many geographies that can be represented by a number of related data layers, refer to the attached figure. A GIS is capable of handling various layers of data and perform analysis among them Such as proximity Analysis or overlaying: How many trees within 0.5 miles from the stream? Or the area of parcels on Clay soil of no more than 2% slope?
Spatial Queries • can easily be answered knowing location information, and are based on spatial relationships • Spatial Relationships Between Features • What is next to what? What is contained in what? • Which features cross each other? • Which features are nearest others? • Example: • refer to the table in the next slide and judge whether GIS is needed to answer:
What is the average number of people working with GIS in the cities shown in the table? • Which cities lie within 1000 miles of each other? • How many people working with GIS in European major cities? • What is the shortest route passing through those cities?
GIS and Data Linkage • Attributes of features are linked together if they relate to the same geographical area. If the attributes of features are linked, deeper analysis can be done. But first features must match between the different layers of data. Point and line features can easily be matched, area features are matched by: • Exact matching: linkage through a single ID or attribute of exactly matching boundaries. • Hierarchical matching: Boundaries do not match, must join boundaries first to get exact matching. For example, we have population data by tracts in counties and unemployment by counties, you need hierarchical matching to study unemployment ratio by counties.
Fuzzy matching: boundaries of areas in a layer do not match those in another layer even if joined. “Overlay” produces smaller areas of different combinations. Example, most productive soil for a particular crop, use two layers: soil types and crop productivity. • Assume that you have tens of data sets (layers) for a large area, a county for example, there can be millions of possible combinations. • Not all the combinations are useful: areas of certain soil types and certain slopes maybe useful, but soil types and unemployment may not. • Linking the data together through a GIS enables the user to add value to the database and generate more information easily.
Questions a GIS can answer 1- Location: where is a certain feature by zip code, by coordinates, by place name, by address, or by some other means. 2- Condition: find a location where certain conditions are satisfied. Requires spatial analysis, new road or power plant for example. 3- Trends: changes at a certain area over time. Requires the knowledge of location and condition. - Is it true that the Mediterranean sea and population growth is consuming the delta in Egypt? - Effect of the High Dam on coastal areas over the years
4- Spatial patterns: is cancer a major cause of death among residents near a nuclear power station? 5- Modeling: what happens if a road is added to a network? The answer may require additional information.