Download
1 / 1
10 likes | 110 Views
Figure 1. 0.14. F (2, 64) = 19.20, p < .001. 0.12. 0.1. 0.08. Accuracy Difference Score (Gun – Tool). Black. White. 0.06. 0.04. 0.02. 0. Alcohol. Control. Placebo. Beverage Group. 1.00. Figure 3. 0.95. 0.90. 0.85. 0.80. Alcohol. Judgment Accuracy. 0.75. Placebo.

E N D
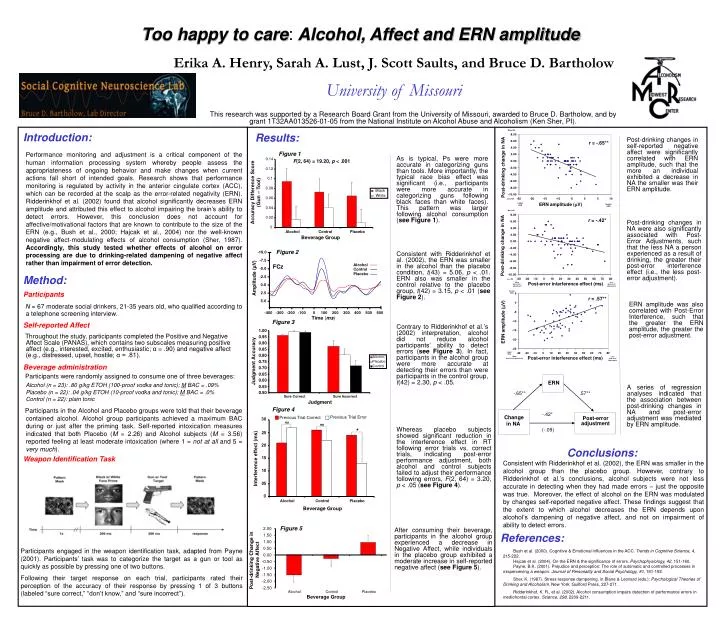
Figure 1 0.14 F(2, 64) = 19.20, p < .001 0.12 0.1 0.08 Accuracy Difference Score (Gun – Tool) Black White 0.06 0.04 0.02 0 Alcohol Control Placebo Beverage Group 1.00 Figure 3 0.95 0.90 0.85 0.80 Alcohol Judgment Accuracy 0.75 Placebo Control 0.70 0.65 0.60 0.55 ERN 0.50 -.65** .57** Sure Correct Sure Incorrect Judgment -.42* Change in NA Post-error adjustment (-.09) 2.00 1.50 1.00 0.50 0.00 -0.50 -1.00 -1.50 -2.00 -2.50 Alcohol Control Placebo Beverage Group Too happy to care: Alcohol, Affect and ERN amplitude Erika A. Henry, Sarah A. Lust, J. Scott Saults, and Bruce D. Bartholow University of Missouri This research was supported by a Research Board Grant from the University of Missouri, awarded to Bruce D. Bartholow, and by grant 1T32AA013526-01-05 from the National Institute on Alcohol Abuse and Alcoholism (Ken Sher, PI). Introduction: Performance monitoring and adjustment is a critical component of the human information processing system whereby people assess the appropriateness of ongoing behavior and make changes when current actions fall short of intended goals. Research shows that performance monitoring is regulated by activity in the anterior cingulate cortex (ACC), which can be recorded at the scalp as the error-related negativity (ERN). Ridderinkhof et al. (2002) found that alcohol significantly decreases ERN amplitude and attributed this effect to alcohol impairing the brain’s ability to detect errors. However, this conclusion does not account for affective/motivational factors that are known to contribute to the size of the ERN (e.g., Bush et al., 2000; Hajcak et al., 2004) nor the well-known negative affect-modulating effects of alcohol consumption (Sher, 1987). Accordingly, this study tested whether effects of alcohol on error processing are due to drinking-related dampening of negative affect rather than impairment of error detection. Method: Participants N = 67 moderate social drinkers, 21-35 years old, who qualified according to a telephone screening interview. Self-reported Affect Throughout the study, participants completed the Positive and Negative Affect Scale (PANAS), which contains two subscales measuring positive affect (e.g., interested, excited, enthusiastic; α = .90) and negative affect (e.g., distressed, upset, hostile; α = .81). Beverageadministration Participants were randomly assigned to consume one of three beverages: Alcohol (n = 23): .80 g/kg ETOH (100-proof vodka and tonic); M BAC = .09% Placebo (n = 22): .04 g/kg ETOH (10-proof vodka and tonic); M BAC = .0% Control (n = 22): plain tonic Participants in the Alcohol and Placebo groups were told that their beverage contained alcohol. Alcohol group participants achieved a maximum BAC during or just after the priming task. Self-reported intoxication measures indicated that both Placebo (M = 2.26) and Alcohol subjects (M = 3.56) reported feeling at least moderate intoxication (where 1 = not at all and 5 = very much). Weapon Identification Task More NA Results: Post-drinking changes in self-reported negative affect were significantly correlated with ERN amplitude, such that the more an individual exhibited a decrease in NA the smaller was their ERN amplitude. r = -.65** As is typical, Ps were more accurate in categorizing guns than tools. More importantly, the typical race bias effect was significant (i.e., participants were more accurate in categorizing guns following black faces than white faces). This pattern was larger following alcohol consumption (see Figure 1). Post-drinking change in NA Less NA ERN amplitude (V) Larger ERN Smaller ERN More NA r = -.42* Post-drinking changes in NA were also significantly associated with Post-Error Adjustments, such that the less NA a person experienced as a result of drinking, the greater their post-error interference effect (i.e., the less post- error adjustment). Post-drinking change in NA Figure 2 -10.0 Consistent with Ridderinkhof et al. (2002), the ERN was smaller in the alcohol than the placebo condition, t(43) = 5.06, p < .01. ERN also was smaller in the control relative to the placebo group, t(42) = 3.15, p < .01 (see Figure 2). -7.5 Alcohol FCz -5.0 Control Placebo -2.5 Amplitude (µV) Less NA Post-error interference effect (ms) More post-error adjustment Less post-error adjustment 0.0 Smaller ERN 2.5 r = .57** 5.0 ERN amplitude was also correlated with Post-Error Interference, such that the greater the ERN amplitude, the greater the post-error adjustment. -400 -300 -200 -100 0 100 200 300 400 500 600 Time (ms) ERN amplitude (V) Figure 3 Contrary to Ridderinkhof et al.’s (2002) interpretation, alcohol did not reduce alcohol participants’ ability to detect errors (see Figure 3). In fact, participants in the alcohol group were more accurate at detecting their errors than were participants in the control group, t(42) = 2.30, p < .05. Larger ERN Post-error interference effect (ms) More post-error adjustment Less post-error adjustment A series of regression analyses indicated that the association between post-drinking changes in NA and post-error adjustment was mediated by ERN amplitude. Figure 4 Previous Trial Error Previous Trial Correct 30 ns ns Whereas placebo subjects showed significant reduction in the interference effect in RT following error trials vs. correct trials, indicating post-error performance adjustment, both alcohol and control subjects failed to adjust their performance following errors, F(2, 64) = 3.20, p < .05 (see Figure 4). * 25 Conclusions:Consistent with Ridderinkhof et al. (2002), the ERN was smaller in the alcohol group than the placebo group. However, contrary to Ridderinkhof et al.’s conclusions, alcohol subjects were not less accurate in detecting when they had made errors – just the opposite was true. Moreover, the effect of alcohol on the ERN was modulated by changes self-reported negative affect. These findings suggest that the extent to which alcohol decreases the ERN depends upon alcohol’s dampening of negative affect, and not on impairment of ability to detect errors. References: Bush et al. (2000). Cognitive & Emotional influences in the ACC. Trends in Cognitive Science, 4, 215-222. Hajcak et al. (2004). On the ERN & the significance of errors. Psychophysiology, 42, 151-160. Payne, B.K. (2001). Prejudice and perception: The role of automatic and controlled processes in misperceiving a weapon. Journal of Personality and Social Psychology, 81, 181-192. Sher, K. (1987). Stress response dampening, in Blane & Leonard (eds.): Psychological Theories of Drinking and Alcoholism. New York: Guilford Press, 227-271. Ridderinkhof, K. R., et al. (2002). Alcohol consumption impairs detection of performance errors in mediofrontal cortex. Science, 298, 2209-2211. 20 15 Interference effect (ms) 10 05 0 Alcohol Control Placebo Beverage Group Figure 5 After consuming their beverage, participants in the alcohol group experienced a decrease in Negative Affect, while individuals in the placebo group exhibited a moderate increase in self-reported negative affect (see Figure 5). Participants engaged in the weapon identification task, adapted from Payne (2001). Participants’ task was to categorize the target as a gun or tool as quickly as possible by pressing one of two buttons. Following their target response on each trial, participants rated their perception of the accuracy of their response by pressing 1 of 3 buttons (labeled “sure correct,” “don’t know,” and “sure incorrect”). Post-drinking Change in Negative Affect