Download

1 / 59
590 likes | 819 Views
Epidemiology 217 Molecular and Genetic Epidemiology I. Course Director: John Witte Professor of Epidemiology & Biostatistics. Course Goals. Develop a framework for interpreting and incorporating genetic information in your research Learn: Common genetic measures

E N D
Epidemiology 217Molecular and Genetic Epidemiology I Course Director: John Witte Professor of Epidemiology & Biostatistics
Course Goals • Develop a framework for interpreting and incorporating genetic information in your research • Learn: • Common genetic measures • Approaches to search for disease-causing genes, and their interaction with environmental factors • Pharmacogenomics • Genetic testing, ethics.
Course Details • Class meets for 10 Tuesdays, 1:15-2:45 pm • Course Director: John Witte (jwitte@ucsf.edu) • Co-Director: Eric Jorgenson (eric.jorgenson@ucsf.edu) • Lecturers: Neil Risch, Bernie Lo • website: www.epibiostat.ucsf.edu/courses/schedule/mol_methodsi.html (Lectures, homework assignments & keys, readings)
Assignments • Four problem sets • 15% of grade for each (60% total) • Due at noon on Mondays to: eric.jorgenson@ucsf.edu • Reading assignments / class participation • 10% of grade • Final project (design study) • 30% of grade (due Monday 3/8 at Noon)
Resources • Videos from UAB Short course on statistical genetics: http://www.soph.uab.edu/ssg_content.asp?id=1174 • Dorak’s notes on genetics: http://dorakmt.tripod.com/genetics/ • Strachan & Read’s Human Molecular Genetics: http://www.ncbi.nlm.nih.gov/books/bv.fcgi?rid=hmg
TICR Professional Conduct Statement • I will: • maintain the highest standards of academic honesty • neither give nor receive aid in examinations or assignments unless such cooperation is expressly permitted by the instructor • conduct research in an unbiased manner, reports results truthfully, and credit ideas developed and work done by others • not use answer keys from prior years • write answers in my own words, and, when collaboration is permitted, acknowledge collaborators when answers are jointly formulated
Molecular & Genetic Epidemiology Distinction • Molecular: measurement of non-genetic factors in biospecimens (e.g., selenium in toenails) • Genetic: role of inherited factors in disease Focus of course • Genetic epidemiology • Initially studied single gene disorders • Now more complex genetic disorders and environment • Many designs same as epidemiology (e.g., case-control) • Some specialized analysis methods. • Population genetics increasingly important Aims • Detect genetic causes of disease • Understand biological process • Prevention strategies, lifestyle intervention • Improved therapeutic strategies, personalized medicine
Human Chromosome 21 Telomeres Centromere p: petit arm q: queue (tail) or long arm 21q22.1 is pronounced twenty-one q two two point one
Chromosome Bands • Stain chromosomes so they can be seen by microscope • e.g., Giesma. • Appear as alternating bands • e.g., dark/G-band and light band. • With low resolution, few bands seen: • … p2, p1 centromere q1, q2, … (count out from centromere). • With higher resolution sub bands seen: • … p12, p11 centromere q11, q12 …
Variation in Genome • Mutation • When event first occurs in an individual: • genetic change due to internal events (e.g., copy errors during cell division) or external agents (e.g., radiation, mutagens). • Can end with one generation, or be passed on (germline mutations) • But frequency remains < 1% in a given population • Polymorphism • Means "many forms“ • Frequency > 1% • Generated by old mutations. • ‘Common’ versus ‘rare’
T T G G T G T T G G T G A A A A A A C C C G C C Single Nucleotide Polymorphism (SNPs) • Change a single DNA letter • Most frequent genetic variant • 1/1300 base pairs • ~ 10 million common SNPs (> 1- 5% MAF) - 1/300 bp
Locus 4 Alleles at locus 4 Genotypes Each somatic cell is diploid (two copies of each autosome) Thus, 3 genotypes at locus 4
Noncoding • Coding Synonymous = no change in amino acid Nonsynonymous/nonsense = change to stop codon Nonsynonymous/missense = change amino acid MTHFR C677T SNP Normal (‘wild-type’) allele • Gene sequence …..GCG GGA GCC GAT……………… • Protein Sequence ……Ala Gly Ala Asp……………… • Variant allele • Gene Sequence …..GCG GGA GTC GAT………………. • Protein Sequence ……Ala Gly Val Asp ..…………… Types of Variants
Human Genome Statistics (old) • 3,253,037,807 basepairs • SNPs: 11,772,162 • 21,667 known genes • 1,040 pseudogenes (‘defunct’ genes) • 269,405 exons • Mutation rate ≈ 10-8 per bp per generation • In each person: • 65 new mutations expected • 1 variant per 1,331 basepairs • 2,444,055 variants • Most variants are old http://www.ensembl.org/Homo_sapiens
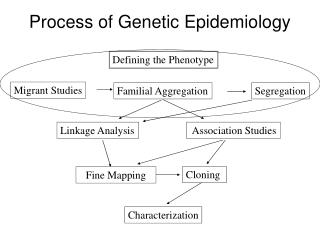
Process of Genetic Epidemiology Defining the Phenotype Migrant Studies Familial Aggregation Segregation Linkage Analysis Association Studies Cloning Fine Mapping Characterization
First: Define the Phenotype! Gleason DF. In Urologic Pathology: The Prostate. 1977; 171-198.
Migrant Studies Weeks, Population. 1999
Example: Standardized Mortality Ratios MacMahon B, Pugh TF. Epidemiology. 1970:178.
Familial Aggregation • Does the phenotype tend to run in families?
Recurrence Risks lR = kR/k, kR is the risk to relatives of type R k is the population risk lS = recurrence risk to siblings of probands versus the general population risk. The higher the value of l, the stronger the genetic effect
Examples of s • Alzheimer Disease 3-4 • Rheumatoid Arthritis 12 • Schizophrenia 13 • Type I Diabetes 15 • Multiple Sclerosis 20-30 • Neural Tube Defects 25-50 • Autism 75-150
Familial Aggregation • One can calculate the familial risk ratio (FRR) from observational data. • With case-control data, calculate FRR as: # cases among relatives of the cases (observed) / # cases among relatives of controls (expected) • For first-degree relatives, FRR equals l1.
Utah Sweden Familial Aggregation:Familial Risk Ratios (FRR) Risch CEBP 2001:10:733-741
FRR versus GRR • How well does FRR estimate the genetic risk ratio? FRR = Pr(Dis|FH+) / Pr(Dis.|FH-) ? Pr(Dis|G+) / Pr(Dis|G-) = GRR
Twin Studies • Compare the disease concordance rates of MZ (identical) and DZ (fraternal) twins. • Then one can estimate heritability of a phenotype. Twin 1
MZ Twins (Identical) Twin 1 Both alleles are shared identical by descent (IBD) Twin 2
DZ Twins (Fraternal) Twin 1 Twin 2: any of the four IBD can be 2, 1, or 0 2 1 1 0
DZ Twins (Fraternal) Twin 1 Average sharing is 50% 100% 50% 50% 0%
IBD Sharing # of alleles shared IBD 2 1 0 Pr(2) Pr(1) Pr(0) Prop IBD Relationship Self, MZ twins 1 0 0 1 Parent, Offspring 0 1 0 1/2 Full siblings 1/4 1/2 1/4 1/2 Gr-child, Gr-prt 0 1/4 3/4 1/4 First cousins 0 1/4 3/4 1/8 Proportion of alleles shared IBD = # alleles x Pr(# alleles) / 2
Analysis of Twin Studies • Compare the disease concordance rates of MZ (identical) and DZ (fraternal) twins. Twin 1 Concordance = 2A/(2A+B+C) Twin 2 Then one can estimate heritability of a phenotype.
Example of Twin Study: PCa • Twin registry (Sweden, Denmark, and Finland) • 7,231 MZ and 13,769 DZ Twins (male) Heritability: 0.42 (0.29-0.50) Non-shared Environment: 0.58 (0.50-0.67) Lichtenstein et al NEJM 2000 13;343:78-85.
Models of Genetic Susceptibility • Study families. • Estimate ‘mode of inheritance’ & what type of genetic variant might be causal. • Determine whether the disease appears to follow particular patterns across generations. • Estimate whether variants are rare or common, etc.
Segregation: Harry Potter’s Pedigree Muggle Wizard / Witch Vernon Dursley Lily Evans James Potter Petunia Dursley Harry Potter Dudley Dursley
Segregation Analysis • What is the best model of inheritance for observed families? • Dominant • Recessive • Additive • Disease allele frequency? • Magnitude of risk? • Fit formal genetic models to data on disease phenotypes of family members. • The parameters of the model are generally fitted finding the values that maximize the probability (likelihood) of the observed data. • This information is useful in parametric linkage analysis, which assumes a defined model of inheritance.
Assignment 1 • Due by Noon on Monday (1/11/10) to eric.jorgenson@ucsf.edu 1) Complete Reading #1: Genetic Epidemiology 1: Key concepts in genetic epidemiology. Burton PR, Tobin MD, Hopper JL. Lancet. 2) Select disease you are interested in and: • Define its clinical characteristics • Determine support for a genetic basis by searching pubmed for ‘disease’ and major terms covered in first lecture. Note # of articles and glance at some abstracts to qualitatively assess the support. Search term # Articles + Support - Support “Genetic Epidemiology” “Migrant Study” “Familial Aggregation” “Twin Studies” “Segregation Analysis” • Based on the above table, do you feel there is a genetic basis for this disease? • Is this for all (homogeneous) groupings of the disease, or particular subtypes?
Process of Genetic Epidemiology Defining the Phenotype Migrant Studies Familial Aggregation Segregation Linkage Analysis Association Studies Cloning Fine Mapping Characterization
Linkage: Harry Potter’s Pedigree Measure co-segregation in pedigree Based on detection of recombination events (meiosis) Muggle Wizard / Witch Vernon Dursley Lily Evans James Potter Petunia Dursley or Harry Potter Dudley Dursley or
Affected sib-pair Linkage D M1 M2 D D M1 M1 M2
Association Studies ROCHE Genetic Education (www)
Linkage Disequilibrium Hirschhorn & Daly, Nat Rev Genet 2005
Affymetrix Array Genome-wide Association Studies (GWAS) Altshuler & Clark, Science 2005; 307:1052-3.
Multi-stage Study Designs Hirschhorn & Daly, Nat Rev Genet 2005
Admixture Mapping • Potentially powerful approach to searching for disease-causing genes • Requires: • Two populations with naturally occurring phenotypic and genetic differences. • Recent gene flow between the populations (e.g., within 10 generations). • Markers in the vicinity of the trait locus will also show excess ancestry from the population with the higher allele frequency
Admixture Mapping Nature Genetics 37, 118 - 119 (2005)
Summary of Main Mapping Approaches Nature Genetics 37, 118 - 119 (2005)
Cloning a Gene • Showing that it is clearly causal for disease. • Generally requires experiments beyond those undertaken by a genetic epidemiologist.
Characterization • Once genes are identified, molecular methods are used to determine the structure of the gene, identification of regulatory elements, etc. • Use epidemiologic studies to distinguish public health implications: • Determine frequencies of causal alleles; and • Characterize their effects—and interacting environmental factors—on disease rates.