Download
1 / 16
160 likes | 240 Views
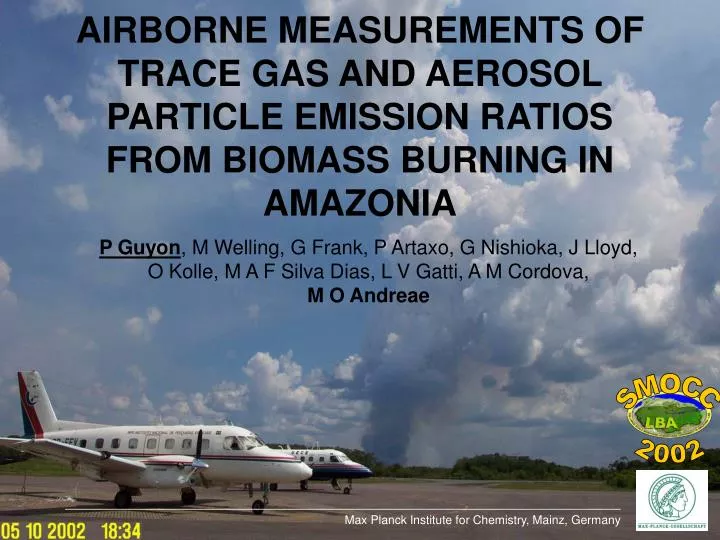
SMOCC. 2002. Max Planck Institute for Chemistry, Mainz, Germany. AIRBORNE MEASUREMENTS OF TRACE GAS AND AEROSOL PARTICLE EMISSION RATIOS FROM BIOMASS BURNING IN AMAZONIA. P Guyon , M Welling, G Frank, P Artaxo, G Nishioka, J Lloyd, O Kolle, M A F Silva Dias, L V Gatti, A M Cordova,

E N D
SMOCC 2002 Max Planck Institute for Chemistry, Mainz, Germany AIRBORNE MEASUREMENTS OF TRACE GAS AND AEROSOL PARTICLE EMISSION RATIOS FROM BIOMASS BURNING IN AMAZONIA P Guyon, M Welling, G Frank, P Artaxo, G Nishioka, J Lloyd, O Kolle, M A F Silva Dias, L V Gatti, A M Cordova, M O Andreae
The SMOCC 2002 experiment(Sep–Nov 2002) Some of the main objectives - Characterize emissions from deforestation fires, especially aerosols - Investigate the impact of smoke aerosols on cloud microphysics and rain formation - Study seasonal differences in atmospheric properties
Instrumentation • CO (Aero-Laser) accuracy/precision ca. 5% • CO2 (LiCor 6251) overall flight precision ca. +/- 0.4 ppm • CN (CPC TSI 3022) precision ca. 5% • Particle number-size distribution (SMPS TSI) • Aerosol Scattering (Nephelometer TSI) precision ca. 5% • Aerosol inlet: isokinetic, accumulation mode < cutoff • Normal temperature and Pressure (25 °C, 1 atm.)
Vertical distribution of CN over clean and smoky regions of the Amazon Elevated plumes Polluted Boundary layer Low CN in background pristine air
Flaming Smoldering CO to CO2 and CN to CO emission ratios from forest fires over the Amazon
In Cloud: • DCO/DCO2 = 52 • DCN/DCO = 19 • Outflow: • here: DCN/DCO = 44 • other cases: • DCO/DCO2 = 50–90 • DCN/DCO = 30–50 In-fire variations of emission ratios • From 4 passes through fresh plume: • DCO/DCO2 = 40–120 • DCN/DCO = 9–35
Above boundary layer Transport ofgases and aerosols Within boundary layer
Max Planck Institute for Chemistry, Mainz, Germany Smoldering in the evening remains at the surface
20 Above boundary layer Transport ofgases and aerosols 25 Within boundary layer
Processing of aerosol particles Moreover:b(700) > b(700)A(450/700) > A(450/700) Processed particles become larger
Max Planck Institute for Chemistry, Mainz, Germany Conclusions • DCN/DCO = 10–40 (savanna: 20–40) • remarkably small variation! • DCO/DCO2: • large variability for flaming phase with values centered around 3–7% (efficient combustion) • smoldering emissions remain close to the surface • Insignificant particle number losses during vertical transport and cloud processing in lower troposphere efficient upward transport of pollutants long range transport
Emission of particles as a function of combustion efficiency
Slide 1: • - Read title/institutions/SMOCC2002 • - Picture in the background taken at our base airport. • - The 2 a/c used. • - Nice fire plume turning into a pyrocloud, allowing vertical transport of aerosols trace gases pollutants from BL to FT. • Slide 2: • - Few words about SMOCC2002 (BB season + transition, JP, Rondônia,…) • - 1 of main objectives = Characterize emissions from deforestation fires, especially aerosols. Not well known in contrast to e. g. savanna fires. • Slide 3 (Instrumentation): • To determine the ERs, we made measurements of CO, CO2, total particle number and particle scattering. Additionally, we measured particle number size distribution and CCN. • Slide 4 (vertical CN gradient): • Coming to some data, this graph presents the “vertical… (title)” • - Over green ocean (background pristine air): little aerosols and virtually no gradient • - In areas under BB influence, typically: • - very polluted BL • - elevated polluted plumes, cloud processed • We have studied these plumes both within and above the BL. • Slide 5 (overall frequency plot): • In order to better understand the contribution of smoke to the atmosphere, we have calculated ERs of CO/CO2 and CN/CO for all the plumes measured with the a/c. ERs are defined as the slope of the regression of CO to CO2 and CN to CO, respectively. • The CO/CO2 ratios describe the combustion efficiency/phase of the fire since smoldering CO, flaming CO2. • This frequency plot shows an overview of all ERs obtained during this campaign. • - For CN/CO, we found values centered around ca. 10–40 # per cm3 and ppb CO. This compares to savanna burning (e.g. Hobbs et al.: ca. 20 – 36 over Africa). • - CO/CO2 ERs showed a large scatter but were overall centered around 4–8% for the most, i.e. quite efficient burning, comparable to savanna. • However, the large variation in ERs is not only due to the differences in burning conditions from fire to fire.
Slide 6 pictures of SLF survey fire: • - Taking this fire as an example, • - after 4 passes over this fire, we obtained DCO/DCO2 values ranging 40–120, almost the whole range of values obtained for all measured fires. • - Same for CN/CO • - hard to give a number for a specific fire • - in cloud: middle, but less relevant • - But looking at the outflow out of the clouds, CN/CO ratio was even slightly higher than that found in the fresh plumes. This was also confirmed in other cases. • Shows that hot fires are an efficient mode of transport for particles, with, at least, little loss, and, in some cases, maybe production of particles out of the cloud. • Slide 7 (Frequency plot ERs below and above BL) • Overall, when separating the ER data into plumes measured below and above the BL, we found that: • - no stat. significant difference for the CO/CO2 data. • - (smoldering circled) Little smoldering was measured from the a/c because smoldering remains close to the surface. • Slide 8 (picture smoldering): • This is because: • - smoldering fires are less vigorous than flaming ones. • - smoldering usually more in the evening when convection has ceased. • Slide 9 (same as Slide 7): • - CN/CO ratio are slightly lower above BL (but the difference is stat. significant) confirming that little particle number loss due to coagulation or scavenging occurs during the upward transport and cloud processing. efficient transport to FT. • Slide 10 (Neph): • However, when looking at the ERs of scattering/CO, the slightly larger amount of particles in the BL (i.e. fresher plumes) are less scattering that the processed aerosols. • Moreover, simultaneous measurements show that the backscatter ratio and the Angstrom coefficient of these particles within the BL are larger than those above BL, pointing at smaller particles than the detrained ones (stat. signif.). • Slide 11 (size distributions): • The size distribution of the detrained smoke coming out of the cloud is typically shifted toward higher diameters. • Slide 12 (CCN): • This has in turn a dramatic effect on the CCN efficiency spectrum of these particles. • Whereas fresh smoke tends to be moderately efficient, with some ca. 50% of the particles activated at 1% ss, aerosols from detrained plumes tend to be much more efficient at making CCNs, close to what we actually measured for background aerosols. • Therefore, these particles which are too numerous and too small to, in the pyrocloud, undergo efficient coalescence as droplets and rainout, are released in the FT as efficient CCNs. • Slide 13 (Conclusions): • - CN/CO ERs are spread over a relatively narrow range between ca. 10 and 40 (both CN and CO primarily emitted during smoldering/less efficient burning). These values compare to savanna ERs. • - The CO/CO2 ERs showed: • - large variability, with values centered around 40–80 (4–8%), which is a quit efficient burning (also comparable to savanna). • - smoldering emissions remain close to surface • - During vertical transport and cloud processing, there is little loss of particles by coagulation and/or coalescence of droplets, and there is a significant growth of the particles. Therefore, this is an efficient mean for upward transport of pollutants from the BL to the mid-troposphere, thereby favoring long-range transport of, among others, efficient CCN and largely scattering particles. • Optional slides: • Slide 14 (Morning bias): • The apparent diurnal pattern of CO/CO2 ERs is actually a bias accruing in the morning hours due to CO2 from the night transpiration being uplifted with the plume, thereby dramatically decreasing the CO/CO2 values. Even examples of purely smoldering large fires showed very small CO/CO2 values in the morning hours. • Probably all ERs relative to CO2 ever measured so far in the morning hours suffered from this bias. These data were removed from the rest of our dataset presented. • Slide 15 (ER CN/(CO+CO2) vs CE) • Shown is the emission of particles as a function of combustion efficiency for all plumes measured in the BL (morning biased data of course removed). • Here, the emission of particles is presented as CN/(CO+CO2), CE is CO2/Ctotal. • There is a significant (r^2 = 0.61) dependence of the emission of particles on CE, with more particles emitted at lower CE (toward smoldering).