Download
1 / 21
210 likes | 367 Views
Title Author. Meeting Dates Location. NASA Aquarius Mission Timeline. Initial SPURS-2 Cruise Window. SPURS-2 Workshop. EOPM OSST Seattle. May. 2-year mean of Aquarius SSS. 2-year mean of Aquarius SSS. Animation of monthly maps. Monthly maps – 2 year average.

E N D
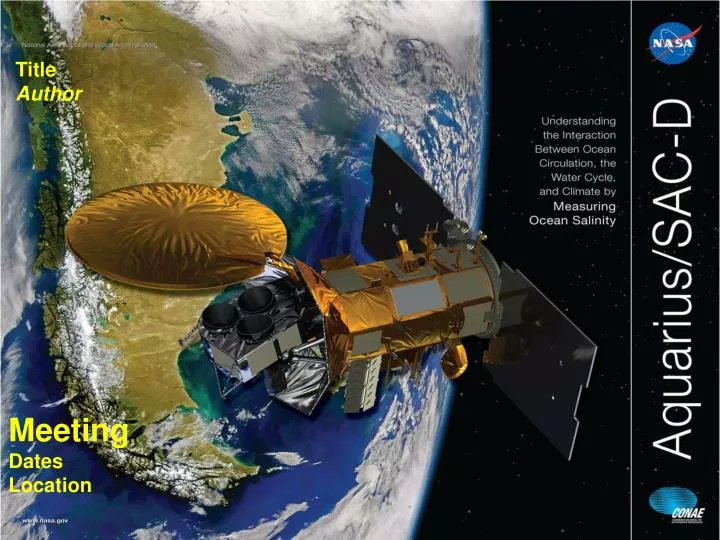
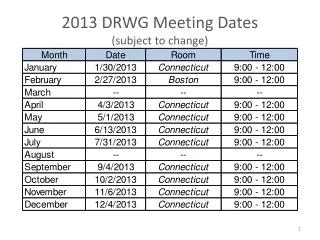
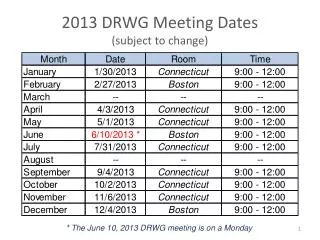
Title Author Meeting Dates Location
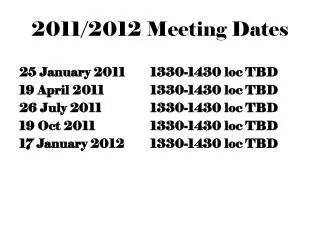
NASA Aquarius Mission Timeline Initial SPURS-2 Cruise Window SPURS-2 Workshop EOPM OSST Seattle May
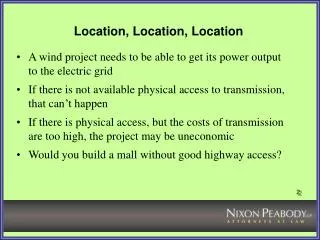
24 month EOF of Aquarius SSS Consider shifting site westward to ~130°W to catch the EOF1 center of action and EOF2 saddle point
Aquarius Captures Pacific TIWs • TIWs affect ocean, climate, biogeochemistry • Aquarius reveals TIWs salinity structure for the 1st time from space). • Brings new understanding to TIWs. Lee, Lagerloef, Gierach, Yueh, Dohan (2012, June GRL) SSS from Aquarius (color shading), SST (contours in a), surface currents (arrows in b) on Dec. 11, 2011 (7-day maps) Reynolds ¼-deg OI PSU OSCAR
Fronts October 2012 monthly averages Above: Aquarius SSS gradients reveal prolific frontal structures that are not evident in Argo OI maps. Dark contour is 34.6 isohaline.Below: Differences between the maps above show (left) that satellite SSS are biased low relative to Argo in high rain regions, and (right) frontal patterns unresolved by Argo. The black contours are 100 mm/month isolines. H.Kao &G.Lagerloef, JGR-Oceans in prep, 2013
Summary • Proposed SPURS-2 site is in zonal band of strongest seasonal SSS variability • EOFs show peak SSS amplitude at ~130W; ~ 0.5 psu amplitude. Coincides with null point in quadrature phase EOF2 • Seasonal cycle is lightly asymmetrical over the year; max SSS in March, min SSS in October • Interannual variations; SSS under the ITCZ in Year 2 (Sep12-Aug13) was significantly less than in Year 1 (Sep11-Aug12). • Proposed site is in the climatological shear zone between NECC and NEC • Fronts varied seasonally and interannually; strongest during the wet season.

![[location]CASA Information Meeting](https://cdn4.slideserve.com/839228/location-casa-information-meeting-dt.jpg)


![[ location]CASA Information Meeting](https://cdn3.slideserve.com/6495861/slide1-dt.jpg)