Download
1 / 36
360 likes | 375 Views
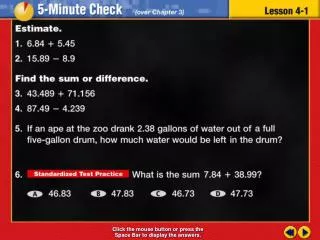
Transparency 1. Click the mouse button or press the Space Bar to display the answers. Splash Screen. Example 1-3b. Objective. Make and interpret frequency tables. Example 1-3b. Vocabulary. Statistics. Collecting, organizing, and interpreting data. Example 1-3b. Vocabulary. Data.

E N D
Transparency 1 Click the mouse button or press the Space Bar to display the answers.
Example 1-3b Objective Make and interpret frequency tables
Example 1-3b Vocabulary Statistics Collecting, organizing, and interpreting data
Example 1-3b Vocabulary Data Pieces of information
Example 1-3b Vocabulary Frequency Table Shows the number of pieces of data that fall within given intervals
Example 1-3b Vocabulary Scale The set of all possible values of a given measurement, including the least and greatest numbers in the set, separated by the intervals used
Example 1-3b Vocabulary Interval Separates the scale into equal parts
Example 1-3b Vocabulary Tally mark Counters used to record items in a group
Lesson 1 Contents Example 1Make a Frequency Table Example 2Make a Frequency Table Example 3Interpret a Frequency Table
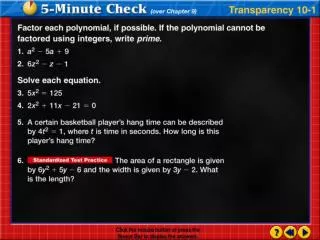
Example 1-1a SCHOOL The grades scored on a surprise quiz are shown in the table. Make a frequency table of the data. You need a ruler! 1/3
Example 1-1b Make a frequency table with at least 7 rows using the lines on your paper A frequency table needs 3 columns Leave the top row with no columns for the title 1/3
Example 1-1b Surprise Quiz Scores Scores Tally Frequency Add Title Add headings to chart The data in the first column which is “scores” The third column is “frequency” The second column is labeled “tally” 1/3
Example 1-1b Surprise Quiz Scores Scores Tally Frequency Choose an appropriate scale and interval for the data Determine the smallest number Determine the largest number 1/3
Example 1-1b Surprise Quiz Scores Scores Tally Frequency 51-60 61-70 71-80 The interval must be the same on each row 81-90 91-100 Since the smallest number is 52 use 51 - 60 for the first interval The interval is 10 so add 10 to each number to make a new interval 1/3
Example 1-1b Surprise Quiz Scores Scores Tally Frequency 51-60 I 61-70 I 71-80 Make a tally mark for each number 81-90 I I 91-100 99 is in the group of 91-100 90 is in the group of 81-90 53 is in the group of 51-60 70 is in the group of 61-70 1/3
Example 1-1b Surprise Quiz Scores Scores Tally Frequency 51-60 I 61-70 I 71-80 I I 83 is in the group of 81-90 81-90 I I I I 91-100 100 is in the group of 91-100 80 is in the group of 71-80 75 is in the group of 71-80 1/3
Example 1-1b Surprise Quiz Scores Scores Tally Frequency 51-60 I 61-70 I I 71-80 I I I 92 is in the group of 91-100 81-90 I I I I I 91-100 I 65 is in the group of 61-70 75 is in the group of 71-80 90 is in the group of 81-90 1/3
Example 1-1b Surprise Quiz Scores Scores Tally Frequency 51-60 I I 61-70 I I 71-80 I I I I 52 is in the group of 51-60 81-90 I I I I I I 91-100 I I 80 is in the group of 71-80 85 is in the group of 81-90 95 is in the group of 91-100 1/3
Example 1-1b Surprise Quiz Scores Scores Tally Frequency 51-60 I I 61-70 I I 71-80 I I I I I 75 is in the group of 71-80 81-90 I I I I I I I 91-100 I I 85 is in the group of 81-90 85 is in the group of 81-90 On the 5th tally put a diagonal across the other 4 tally marks 75 is in the group of 71-80 1/3
Example 1-1b Surprise Quiz Scores Scores Tally Frequency 51-60 I I 2 61-70 I I 2 71-80 I 6 I I I I 81-90 I I I I I 6 I I 4 91-100 I I Count the tally marks and put the number in the frequency column 1/3
Surprise Quiz Scores Scores Tally Frequency 51-60 II 2 61-70 II 2 71-80 IIII I 6 81-90 IIII I 6 91-100 IIII 4 Example 1-1c Answer: 1/3
Example 1-1d SPEED The speeds of cars on the highway are shown in the table below. Make a frequency table of the data. 1/3
Car Speeds (mph) Speed Tally Frequency 50-59 I 1 60-69 IIII IIII 9 70-79 IIII IIII 9 I 80-89 1 Example 1-1e Answer: 1/3
Example 1-2a BUSINESS Owners of Copies ‘R’ Us wanted to move their store to another location. They asked their customers in which general direction they lived from the store. Make a frequency table of the data that resulted from the survey. When there are letters there is no need for intervals 2/3
Example 1-2a Determine how many different letters are used to know how many rows will be needed for the data These are directions N S E W 2/3
Example 1-1b Make a frequency table with at least 6 rows using the lines on your paper (4 for data, 1 for title, 1 for labels) A frequency table needs 3 columns Leave the top row with no columns for the title 1/3
Example 1-2a Customer Directions Frequency Direction Tally Add Title Add headings to chart The data in the first column which is “directions” The third column is labeled “frequency” The second column is labeled “tally” 2/3
Example 1-2a Customer Directions Frequency Direction Tally North South East Since intervals are not needed place the directions in the first column West Notice: The directions were spelled out - not abbreviated like in the chart 2/3
Example 1-2a Customer Directions Frequency Direction Tally North 8 I I I I I I I South 6 I I I I I East 6 I I I I I Make a tally mark for each letter West 4 I I I I On the 5th tally put a diagonal across the other 4 tally marks Count the tally marks and put the number in the frequency column 2/3
Customer Directions Direction Tally Frequency North IIII III 8 South IIII I 6 East IIII I 6 West IIII 4 Example 1-2b Answer: 2/3
Example 1-2c MARKETING An inventor takes a survey to try to determine if the general public would be interested in purchasing his product. He asks people to respond yes, no, or maybe. Make a frequency table of the data that resulted from the survey. 2/3
Opinion Response Tally Frequency Yes IIII III 8 No IIII II 7 Maybe IIII 5 Example 1-2d Answer: 2/3
Favorite School Subject Subject Tally Frequency English IIII IIII 9 History IIII 4 Math IIII IIII I 11 Science IIII IIII IIII 15 Example 1-3a SCHOOL The frequency table below shows sixth-grade students’ votes in one school for favorite subject. What do you think is the most common favorite subject? How did you reach your conclusion? Answer: According to the frequency, science had 15 votes which is more than any other subject - OF COURSE 3/3
Favorite Color Color Tally Frequency red IIII III 8 yellow IIII 4 blue IIII IIII III 13 green IIII I 6 purple III 3 Example 1-3b * COLOR The frequency table below shows middle school students’ responses to a survey about their favorite color. What do you think is the most common favorite color? How did you reach your conclusion? Answer: Blue; it received the most votes with 13. 3/3
End of Lesson 1 Assignment