Download
1 / 11
150 likes | 614 Views
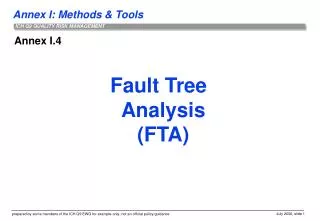
Annex I.1. Basic Risk Management Facilitation Methods. I.1: Basic risk management facilitation methods. Flowchart Check Sheets Process mapping Cause and Effect Diagrams (Ishikawa / fish bone) They might be helpful to support risk identification. Start. Activity. Activity. Decision.

E N D
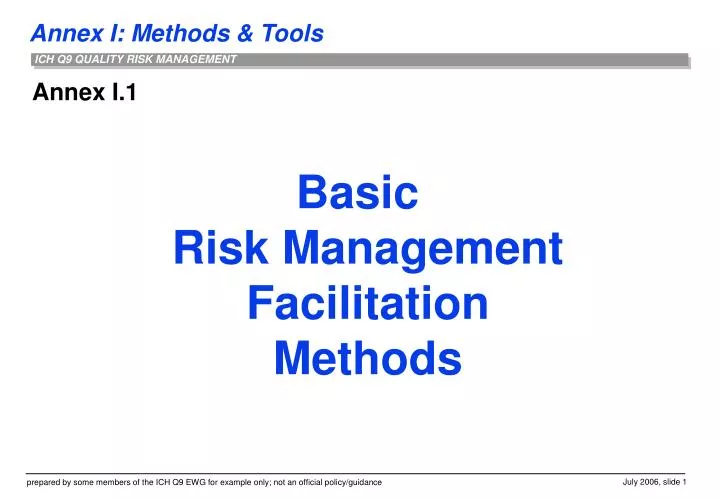
Annex I.1 Basic Risk Management Facilitation Methods
I.1: Basic risk management facilitation methods • Flowchart • Check Sheets • Process mapping • Cause and Effect Diagrams (Ishikawa / fish bone) They might be helpful to support risk identification
Start Activity Activity Decision Action No Yes Result I.1: Basic risk management facilitation methods • Pictorial representations of a process • Breaking the process down into its constituent steps Flowcharts
I.1: Basic risk management facilitation methods Check sheets • Present information in an efficient, clear format • May be accomplished with a simple listing of items
I.1: Basic risk management facilitation methods Process mapping • The indicators may be selected based on unit operations • Shows how they are interrelated Potential Areas of Use(s) / outcomes • Provides a clear and simple visual representationof involved steps • Facilitates understanding, explaining and systematically analyzing complex processes and associated risks • A pre-requisite for the use of some other tools ICH Q9
EXAMPLE I.1: Basic risk management facilitation methods Air • Process mapping Dispensing Fluidized Bed Dryer Sieving Scale Granulation Air Magnesium Stearate Blending Sieving Tabletting Packaging Coating F. Erni, Novartis Pharma
I.1: Basic risk management facilitation methods Cause and Effect Diagrams (Ishikawa / fish bone) Environment People Materials Problemstatement MeasurementSystem Equipment Methods
I.1: Basic risk management facilitation methods Cause and Effect Diagrams (Ishikawa / fish bone) • To associate multiple possible causes with a single effect • Constructed to identify and organize possible causes for it • Primary branch: represents the effect • Major branch: corresponds to a major cause • Minor branch: correspond to more detailed causal factors
I.1: Basic risk management facilitation methods Cause and Effect Diagrams (Ishikawa / fish bone) How to perform? • Define and agree a precise problem statement(put as “head” of fish bone) Think “What could be its causes?” for each node • Add it to the “fish bone” diagram • For each line pursue back to its root cause • Consider splitting up overcrowded sections “bones” • Consider which potential root causes and the need forfurther investigation on them
EXAMPLE I.1: Basic risk management facilitation methods Cause and Effect Diagrams (Ishikawa / fish bone) C. Kingery, The Six Sigma Memory Jogger II
EXAMPLE Coating Drying Milling Analytical Temperature Spray Rate Redrying Pan Speed Temp Time Milling Gun Distance RH Screen Size Other Sampling Temperature Air Flow Porosity Atomizing Air Pressure Mill Speed Shock Cycle Method Tablet Hardness Drug Precompressing Operator Water Substance Main Compressing Temp/RH Age Binder P.S. Operator Feeder Speed Temp Process Conditions LOD Training Press Speed Spray Rate HPMC Punch Penetration Spray Pattern Depth Methoxyl Tooling P.S. Hydroxyl Plant Feed P.S. Scrape Down Factors Frame LOD Other Chopper Speed Compressing Mixer Speed Syloid Lactose Raw Endpoint Coating Materials Granulation Power Time I.1: Basic risk management facilitation methods • Cause and Effect Diagram for Tablet Hardness © Alastair Coupe, Pfizer Inc.