Download
1 / 12
120 likes | 134 Views
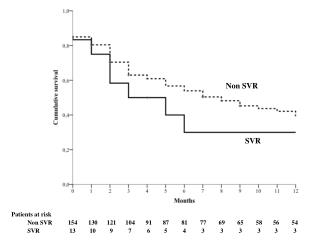
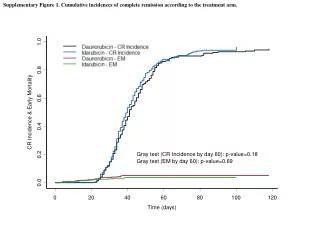
This study compares the cumulative incidences of complete remission, disease-free survival, relapse incidence, treatment-related mortality, and overall survival in leukemia patients based on the treatment arms. It also analyzes the impact of favorable, intermediate, and unfavorable risk cytogenetics on disease-free survival and relapse incidence.

E N D
Supplementary Figure 1. Cumulative incidences of complete remission according to the treatment arm.
Supplementary Figure 2A. 7-year disease-free survival according to the treatment arm. Treatment arms Patients at risk Daunorubicin 330 225 175 160 150 138 126 112 Idarubicin 344 248 202 185 174 163 139 139
Supplementary Figure 2B. 7-year relapse incidence and treatment-related mortality according to the treatment arm.
Supplementary Figure 3. 7-year overall survival of the patients with karyotype failures according to the treatment arm. Treatment arms Patients at risk Daunorubicin 29 26 22 21 20 16 14 14 Idarubicin 21 19 16 15 14 14 13 12
Supplementary Figure 4A. 7-year disease-free survival of the patients with favourable risk cytogenetics according to the treatment arm. Treatment arms Patients at risk Daunorubicin 64 54 47 44 42 42 42 34 Idarubicin 54 46 39 39 38 38 38 38
Supplementary Figure 4B. 7-year disease-free survival of the patients with intermediate risk cytogenetics according to the treatment arm. Treatment arms Patients at risk Daunorubicin 183 121 95 86 79 72 65 65 Idarubicin 210 159 128 118 112 103 90 90
Supplementary Figure 4C. 7-year disease-free survival of the patients with unfavourable risk cytogenetics according to the treatment arm. Treatment arms Patients at risk Daunorubicin 54 26 15 13 13 12 12 12 Idarubicin 59 28 23 17 15 13 13 13
Supplementary Figure 4D. 7-year disease-free survival of the patients with karyotype failures according to the treatment arm. Treatment arms Patients at risk Daunorubicin 27 23 19 18 17 14 12 12 Idarubicin 20 16 14 12 12 12 11 11
Supplementary Figure 5A. 7-year relapse incidence of the patients with favourable risk cytogenetics according to the treatment arm.
Supplementary Figure 5B. 7-year relapse incidence of the patients with intermediate risk cytogenetics according to the treatment arm.
Supplementary Figure 5C. 7-year relapse incidence of the patients with unfavourable risk cytogenetics according to the treatment arm.
Supplementary Figure 5D. 7-year relapse incidence of the patients with karyotype failures according to the treatment arm.