Download
1 / 21
210 likes | 843 Views
The normal approximation to the Binomial variable. B(n,p). N( μ =np, σ 2 =np(1-p)). M&M example. In a large bowl of M&M’s, the proportion of blues is 1/6 (or .17). X- the number of blue M&M’s in a sample of size 6 X~B(6, 1/6)

E N D
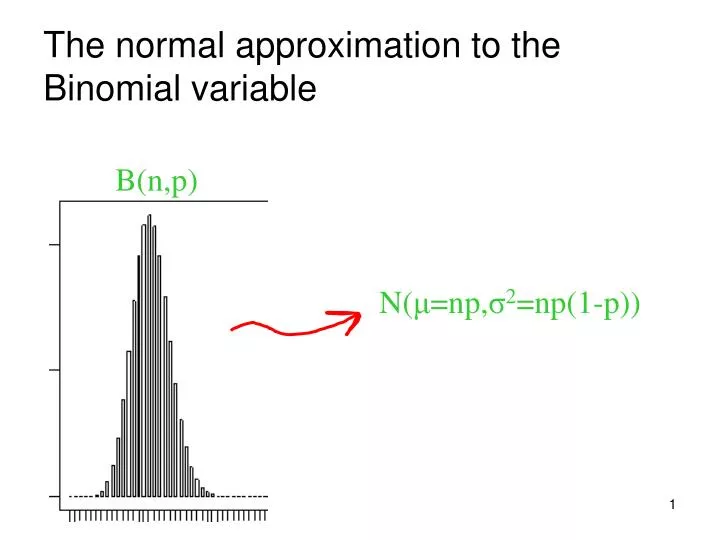
The normal approximation to the Binomial variable B(n,p) N(μ=np,σ2=np(1-p))
M&M example In a large bowl of M&M’s, the proportion of blues is 1/6 (or .17). X- the number of blue M&M’s in a sample of size 6 X~B(6, 1/6) Draw the probability histogram of X and compute its mean and SD .5 .4 .3 .2 .1 0 1 2 3 4 5 6 Shape: Skewed right Mean: 6(1/6)=1 SD: √6(1/6)(5/6)=.9
Suppose we take a sample of size 30 from the M&M bowl X~B(30, 1/6) Describe the center, spread, and shape of the distribution of X x P( X = x ) 0.00 0.0037 1.00 0.0230 2.00 0.0682 . . . 30.00 0.000 Minitab: ..\binomial in class.MPJ
X~B(30, 1/6) Shape: Smoother, more bell shaped Mean: 30(1/6)=5 SD: √30(1/6)(5/6)=2
Suppose we take a sample of size 90 from the M&M bowl X~B(90, 1/6) Describe the center, spread, and shape of the distribution of X x P( X = x ) 0.00 0.0000 1.00 0.0000 2.00 0.0000 3.00 0.0001 4.00 0.0002 . . 90.00 0.000
X~B(90, 1/6) Shape: Even smoother, more bell shaped – very close to a normal curve Mean: 90(1/6)=15 SD: √90(1/6)(5/6)=3.5
The binomial variable X~B(90, 1/6) behaves approximately like a normal variable with mean 15 and SD 3.5
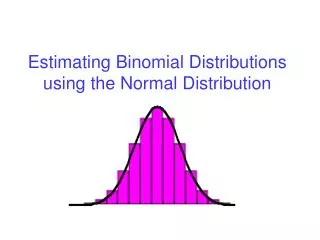
The Normal approximation to the Binomial distribution As sample size n gets large, the distribution of the binomial random variable X is well approximated by the normal distribution, with the same mean and SD of the binomial variable: If X~B(n,p) as n increases X~>N(μ=np, σ=√np(1-p))
The Normal approximation to the Binomial distribution How large should n be? This depends on the value of p. If p is close to 0.5, then the normal approximation applies for small values of n If p is far from 0.5, larger values of n are needed. The following rule of thumb helps us decide when to use the normal approximation: np≥15 and n(1-p) ≥15
Example Check if the rule of thumb is satisfied for: • B(n=6, p=1/6) no, since np=6(1/6)=1<15 2. B(n=90, p=1/6) yes, since np=90(1/6)=15 and n(1-p)=90(5/6)=75>15
Example of normal approximation to binomial You operate a restaurant. You read that sample survey by the National Restaurant association shows that 40% of adults are committed to eating nutritious food when eating away from home. To help plan your menu, you decide to conduct a sample survey in your own area. You will use random digit dialing to contact an SRS of 200 households by telephone. If the national results hold in your area, it is reasonable to use B(200,0.4) distribution to describe the count X of respondents who seek nutritious food when eating out. • What is the mean number of nutrition-conscious people in your sample if p=.4 is true? Mean of B(200,.4)=200(.4)=80 SD=√200(.4)(.6)=√48=6.93 (b) Use the normal approximation to compute the probability that X lies between 75 and 85
Is the normal approximation appropriate? np=200(.4)=80>15 n(1-p)=200(.6)=120>18 X~>N(80,6.932) p(75≤X≤85) =
The normal approximation applies also for proportions Next we will show that if X~B(n,p), As n increases – is approximately N( )
The normal approximation applies also for proportion A poll that surveyed 500 people found that 45% of them support military action in Iraq. X – the number of people that support military action in Iraq in a sample of 500 people X~B(500,0.45) Since np=500(.45)=225 and n(1-p)=500(.55)=275 we can use the normal approximation: μX=np=225 σX=√ np(1-p)=√500(.45)(.55)=√123.75 = 11.12 X~>N(225, 11.122) Is the normal approximation appropriate in this case?
X n X n Lets define a new variable: - the proportion of people that support military action in Iraq Instead of looking at the number of people who support that attack, we can look at the proportion of people who support the attack. Denote this proportion by How does behave? If X is Normal, any linear transformation of X is also normal. Since is a linear transformation of X - is approximately normal (note that X is approximately normal) Calculating the mean and SD of requires some definitions
Mean and SD of a linear transformation of a random variable If X is a random variable and a and b are fixed numbers: μa+bX=E(a+bX)=a+bμX σ2a+bX=Var(a+bX)=b2σ2X
Summary - Normal approximation to the Binomial distribution If X~B(n,p) as n increases (rule of thumb:np≥15 and n(1-p) ≥15)
Back to the example μ = p = 0.4 σ =
Example of normal approximation to binomial You operate a restaurant. You read that sample survey by the National Restaurant association shows that 40% of adults are committed to eating nutritious food when eating away from home. To help plan your menu, you decide to conduct a sample survey in your own area. You will use random digit dialing to contact an SRS of 200 households by telephone. If the national results hold in your area, it is reasonable to use B(200,0.4) distribution to describe the count X of respondents who seek nutritious food when eating out. • What is the mean number of nutrition-conscious people in your sample if p=.4 is true? (b) Define by p-the proportion of people in the sample that seek nutritious food when eating out. p=X/n. Use the normal approximation to compute the probability that the p is larger than 0.7.